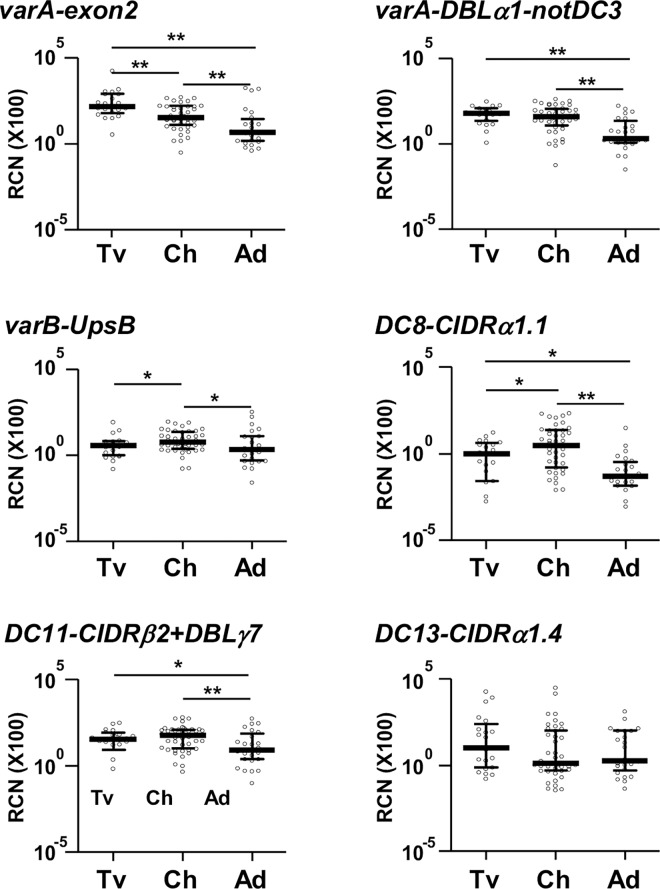
Fig 3. Transcript levels of var/DCs in P. falciparum isolates from travelers, children with uncomplicated malaria and adults.
Transcript levels (y axis) correspond to relative copy number relative to seryl-tRNA synthetase gene copies (X100). Bars represent the median and interquartile range. Transcript levels were compared between groups by Mann-Whitney test, with * indicating P<0.05 and ** if statistically significant after Benjamini-Hockberg correction. RCN: Relative copy number; DC: Domain Cassette; Tv: travelers, Ch: Mozambican children, Ad: Mozambican adults.

