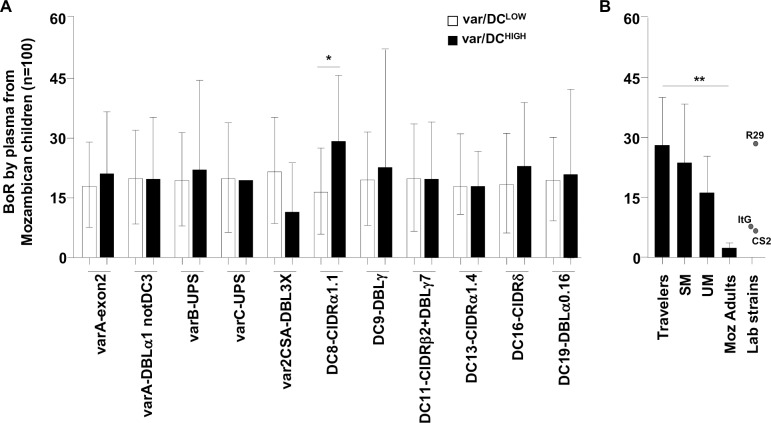
Fig 4. Breadth of IgG recognition of P. falciparum isolates according to var transcript levels and origin.
Geometric Mean Fluorescence Intensity (GMFI) values from each parasite/plasma combination were scored in relation to the threshold of positivity (GMFI of negative controls plus two standard deviations), with a score of 0 assigned if GMFI values were below the cut-off; 1 if the value was between one- and two-fold the cut-off; 2 if the value was between two- and three-fold the cut-off; and so on until a maximum score of 5. Breadth of IgG recognition (BoR) was calculated as the sum of scores obtained for each parasite and expressed as percentage of the maximum score possible. BoR was compared between A) isolates transcribing var/DCs at low- or high- levels by negative binomial regression models adjusted by age and B) between isolates collected from travelers (n = 3), severe malaria (SM, n = 23), uncomplicated malaria (UM, n = 15) children and adults (Moz adults, n = 4) by test for trend across ordered groups. Bars represent the mean of BoR and standard deviation. * indicates P<0.05 and ** P≤0.001.

