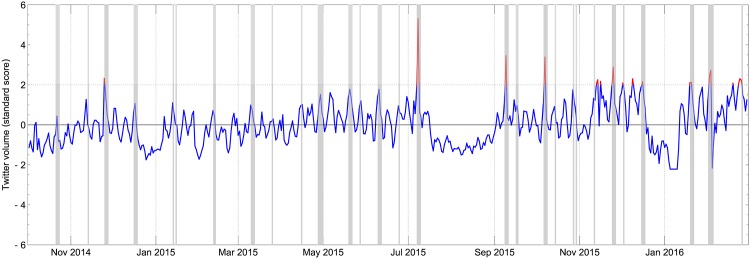
Fig 1. Timeline of Twitter activity of MEPs and roll-call voting sessions.
Twitter activity is represented by the total number of tweets posted by all MEPs on a given day. The volume is standardized and the solid blue line represents the standard score. The peaks in Twitter activity that are above two standard deviations are highlighted in red. The shaded regions correspond to days with roll-call voting sessions.

