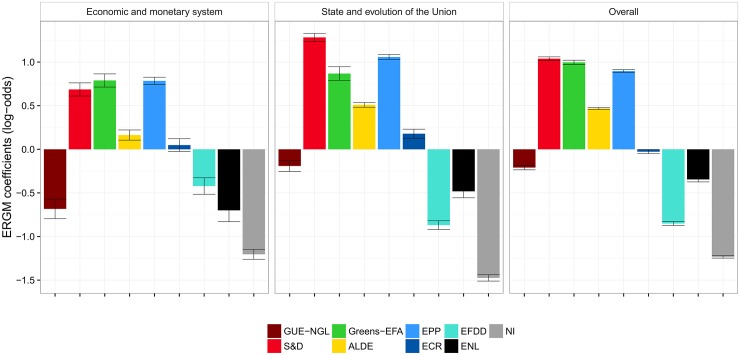
Fig 4. Cohesion of political groups in terms of RCVs as measured by ERGM.
There are two selected policy areas (the left-hand panels), and overall cohesion across all policy areas (the right-hand panel). The coefficients of 0 indicate baseline, i.e., an even chance of the same votes within a group. Log-odds of +1 (−1) correspond to an increase (decrease) of probability for 0.23 of co-voting together.

