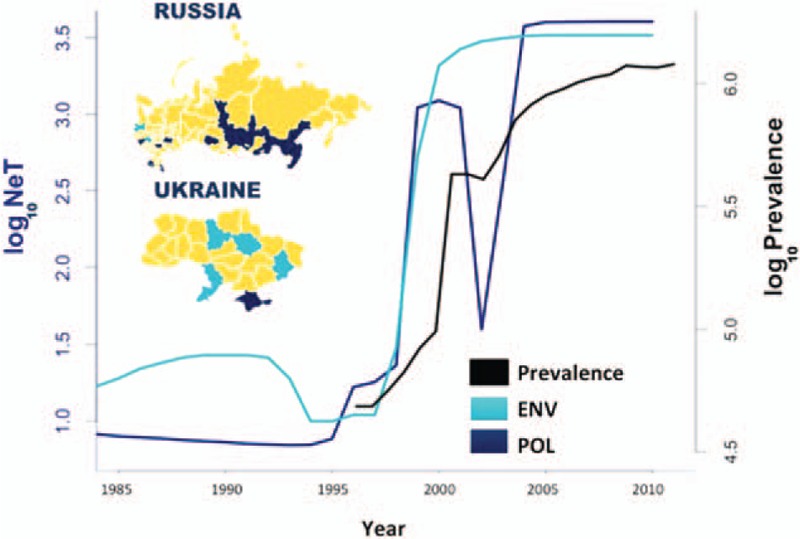
Fig. 1.
Bayesian Skyline Plot estimated from pol (dark blue line) and env (cyan line).

Maps show representation of sequences by geographical regions within the countries. The UNAIDS estimates of HIV prevalent cases are shown by the black line (prevalence).
