
Fig. 2.
Spirometric abnormalities in HIV-infected participants and HIV-uninfected participants.
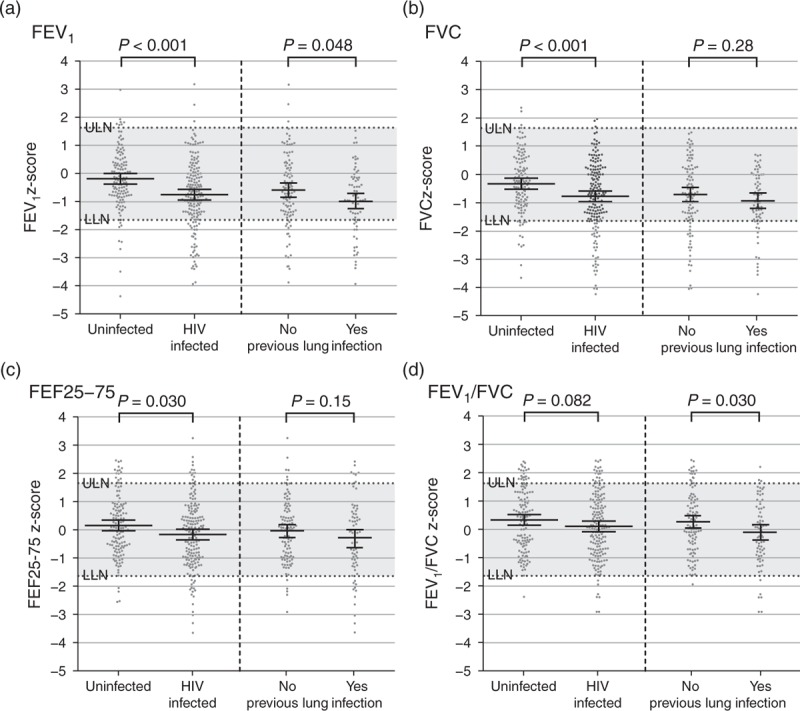
Dot plots of all participants with spirometry results, presented as z-scores compared with GLI 2012 reference ranges. Bars illustrate the mean and SDs of each group. Dotted horizontal bars show the limits of normality. P values are derived from t tests. HIV-infected individuals are further shown by stratification by ‘Prior lung infection’. This is a compound definition, including individuals with any of tuberculosis, PCP, nontuberculous mycobacteria by sputum culture, and hospitalization for chest infection.