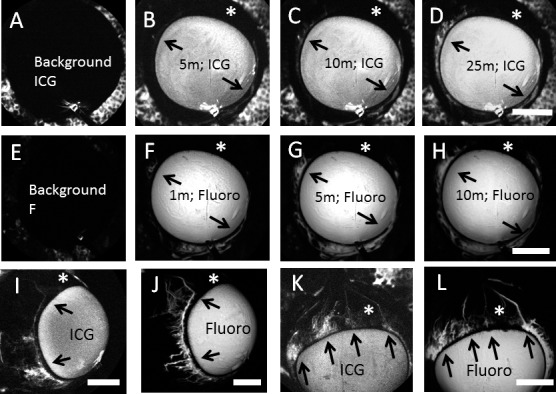
Figure 9.

Sequential Aqueous angiography with ICG followed by fluorescein (Fluoro) demonstrated similar patterns. Sequential aqueous angiography was performed first with ICG followed by fluorescein. (A–H) Sequential aqueous angiography was conducted in one cow eye with (B–D) ICG administration and ICG capture mode before (F–H) fluorescein administration and fluorescein capture mode over time. (A, E) Background images demonstrated lack of fluorescence with appropriate capture modes. (A–H) Comparing the ICG and fluorescein patterns, regions with (arrows) and without (asterisks) angiographic signal were similar. Tangential imaging with sequential aqueous angiography using ICG first followed by fluorescein in two additional eyes ([I, J] and [K, L]) also showed the same result in that regions with (arrows) and without (asterisks) angiographic signal appeared similar comparing the two dyes. Scale bars: 1 cm.
