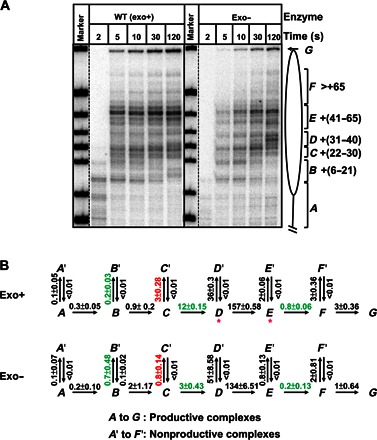
Fig. 3. Kinetic analysis of replication through a nucleosome by exo+ and exo− replisomes.

(A) 603 nucleosomes were replicated by exo+ and exo− replisomes for indicated time intervals. End-labeled DNA was analyzed by denaturing PAGE. The intranucleosomal pauses and runoff (from A to G) were quantified using a Phosphorimager and the OptiQuant software. (B) The quantified data were analyzed using an elongation model that produces a good fit of the experimental data to the calculated curves (fig. S4). The fitting curves (fig. S4) and kinetic parameters were obtained using the KinTek Explorer software. All rate constants were averages from three independent experiments. Rate constants that are more than threefold different between the two forms of DNAPs are marked by green and red colors (for positive and negative effects on processivity of the exo+ replisome, respectively). Note that the exo+ replisome has a higher overall rate of replication through the nucleosome than exo−; the rates of replication through the +(31–40) and +(41–65) regions have the largest differences.
