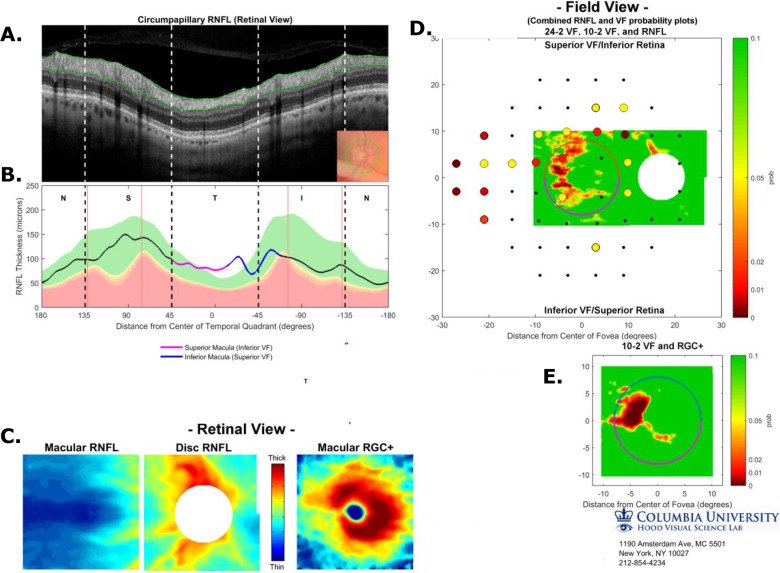
Figure 1.
Single-page Inner Retina Report based upon three SD-OCT scans, a circle scan, a cube scan of the disc, and a cube scan of the macula. (A) Image from circle scan of disc. (B) The cpRNFL thickness plot displayed from N to S, to T to I to N quadrants based upon the cube scan of the disc. Vertical black dashed lines show the borders of the quadrants and the red lines the average locations of the major blood vessels. (C) Thickness maps of macular RNFL (left), disc RNFL (middle), and macular RGC+ (right), all in retina view. (D) The associate probability maps for the two RNFL thickness maps in (C) aligned based upon the centers of the disc and macula are shown in field view with the results of the 24-2 VF superimposed. The calibration bar to the right shows the probabilities for both the VF and the thickness map. (E) Probability map as in (D) based upon the macular RGC+ thickness map in (C) (right). (See Hood & Raza, 20141; Hood et al, 20142 for more details).

