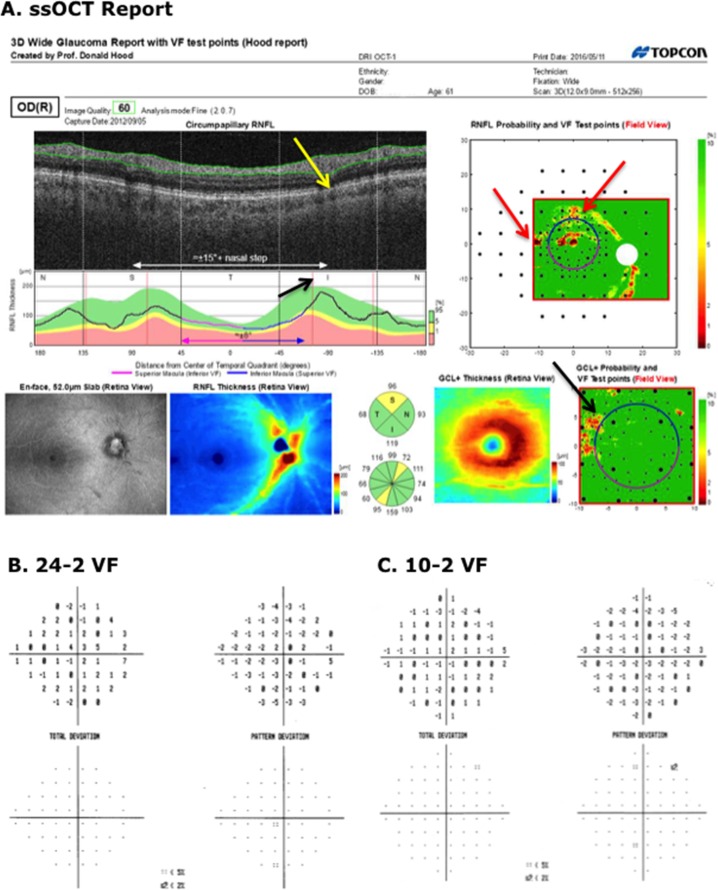
Figure 4.
(A) Wide-field SS-OCT report for an eye classified as “healthy” by the glaucoma specialists, but as ON by the report specialist. The red arrows indicate regions thinner than norms. The black arrow indicates the average location of the major inferior temporal blood vessels and the yellow arrow the location of these blood vessels for this eye. (B, C) The 24-2 and 10-2 VFs for this eye.

