
Fig. 1. Assessment of GCaMP3 and GCaMP6s activity and sensitivity in DRG neurons in vitro.
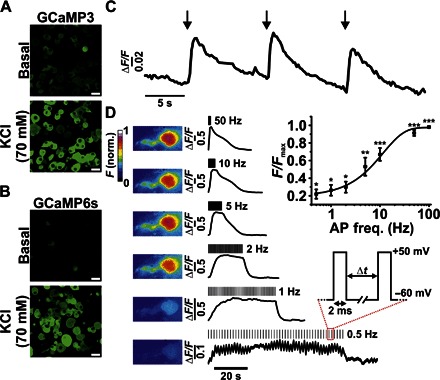
(A and B) Confocal images showing changes in fluorescence from GCaMP3-expressing (A) and GCaMP6s-expressing (B) DRG neurons following the application of KCl. Scale bars, 20 μm. (C) Fluorescence response profile of an individual GCaMP6s-expressing neuron in response to single depolarizing pulses. (D) Heatmap and corresponding fluorescence response of a single GCaMP3-expressing neuron in response to depolarizing pulses at variable frequency stimulations. Inset: Averaged responses shown as a function of frequency stimulation [action potential frequency (AP freq.) in hertz; *P < 0.05, **P < 0.01, and ***P < 0.001, repeated-measures analysis of variance (ANOVA); n = 7]. norm., normalized.