
Fig. 2. Assessment of GCaMP3 activity and sensitivity in DRG neurons in vivo.
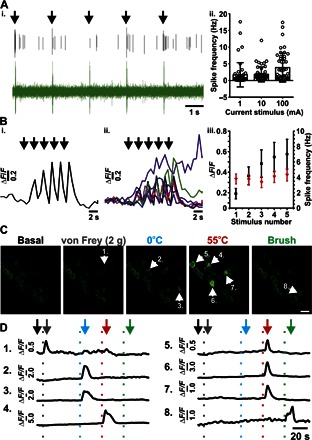
(Ai) Extracellular electrophysiological recording from an intact L4 DRG in vivo showing individual action potentials being elicited by brief (20 ms) 100-mA pulses (denoted by black arrows). The upper black trace shows activity from a single neuron extracted from the raw signal (green). (Aii) Summary of the average number of action potentials elicited from individual neurons in response to 1-, 10-, and 100-mA pulses (20 ms; n = 48). (Bi) Example fluorescence trace of a single GCaMP3 neuron in response to a train of 100-mA pulses (20 ms, 0.5 Hz). Responses from all neurons analyzed are shown in (Bii) (n = 7). (Biii) Summary of the average change in fluorescence (ΔF/F) for each GCaMP3 neuron for sequential current stimulations (100 mA, 20 ms, 0.5 Hz). The average number of action potentials elicited per current injection is overlaid in red (n = 48). (C) In vivo confocal images showing the levels of GCaMP3 fluorescence from L4 DRG neurons in response to the stimuli applied to the plantar surface. Numbered arrows indicate activated neurons within each application frame. Scale bar, 20 μm. (D) Raw traces of each neuron labeled with a numbered arrowhead in (C). The vertical dotted lines represent the points at which the stimuli were applied to the plantar surface. Gray, von Frey; blue, 0°C water; red, 55°C water; green, light brush. The arrows mark the points at which the frames in (C) were taken for each stimulus event.