
Fig. 4. Assessment of cold and heat sensitivity in cultured DRG neurons in vitro.
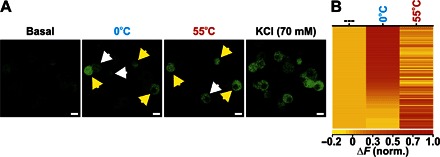
(A) In vitro images showing changes in GCaMP3 fluorescence from cultured DRG neurons at rest (basal) and in response to perfused 0°C extracellular solution, 55°C extracellular solution, and KCl. Unimodal (white arrowheads) and polymodal (yellow arrowheads) neurons are shown. Scale bars, 10 μm. (B) Heatmap response profiles for every neuron responsive to 0° or 55°C stimuli. Each row displays the maximum normalized fluorescent signal acquired during each application window (n = 171).