
Fig. 6. The effect of inflammatory agents on the sensory modalities response of DRG neurons in vivo.
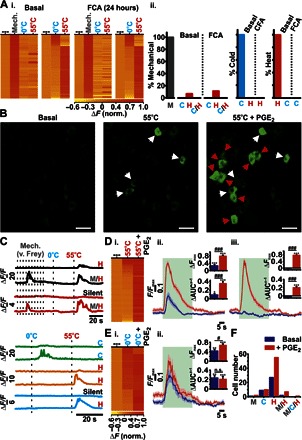
(Ai) Heatmap response profiles for individual GCaMP3-expressing mechanically sensitive (pinch) neurons tested for sensitivity toward mechanical (pinch), 0°, and 55°C stimuli (left), as well as neurons responsive to 0° or 55°C stimuli (right), before (basal; n = 31 and n = 146, respectively) or 24 hours after administration of FCA (n = 90 or n = 102, respectively). (Aii) Summary of mechanically sensitive neurons responding to thermal stimuli as well as thermal-sensitive neurons responding to 55° or 0°C before and 24 hours after the administration of FCA, respectively. Baseline (n = 13 animals) and after FCA (n = 10 animals). (B) In vivo confocal images showing levels of GCaMP3 fluorescence from L4 DRG neurons that respond to 55°C before (pre-PGE2) and 10 min after administration of PGE2 (55°C + PGE2). Basally responsive (white arrowheads) and basally silent (red arrowheads) neurons are shown. Scale bars, 50 μm. (C) Example raw traces of neuronal modality profiles before and after PGE2 administration. (Di) Heatmap response profile for individual neurons responsive to 55°C before or after PGE2 administration. Trace showing the average change in GCaMP3 fluorescence following peripheral noxious heat stimulation (green application bar) from basally heat-responsive neurons (Dii) or basally silent neurons (Diii). AUC, area under the curve. (Ei) Heatmap response profile for individual neurons responsive to 0°C before or after PGE2 administration. (Eii) Trace showing the average change in GCaMP3 fluorescence following peripheral noxious cold stimulation (0°C; green application bar) from basally cold-responsive neurons. Changes in relative maximal fluorescence and AUC (insets). n.s., not significant. (F) Summary of the number of cells displaying discrete modalities before and after PGE2 administration (n = 75) [*P < 0.05, **P < 0.01, and ***P < 0.001 (comparisons made to baseline); #P < 0.05 and ###P < 0.001 (comparisons made between groups)]. Pre- and post-PGE2 recordings were made from five animals. M, mechano; C, cold; H, heat; M/H, mechano-heat; M/C/H, mechano-cold-heat; C/H, cold and hot.