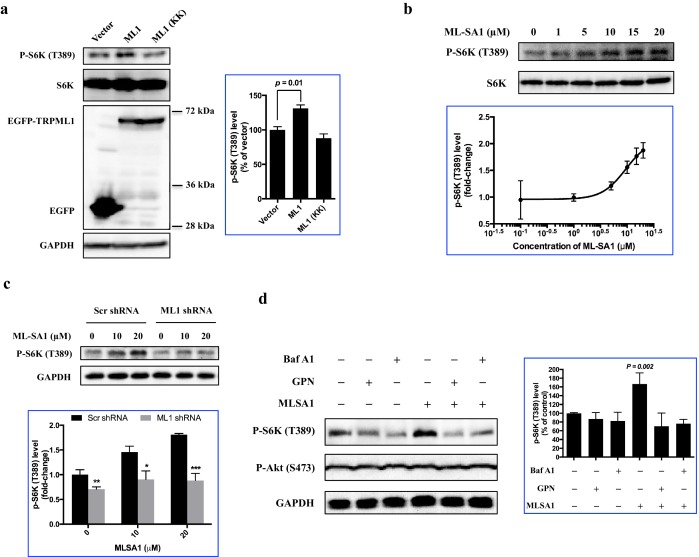
Figure 2. Overexpression or pharmacological stimulation of TRPML1 activates mTORC1 signaling pathway.
(a) HEK293T cells (80% confluency) were transfected with EGFP vector, EGFP-TRPML1 or its non-conducting pore mutant (D471K/D472K) EGFP-TRPML1 (KK) for 20 hr. Cells were lysed and subjected to immunoblotting. The plot shows the percentage of p-S6K levels compared with vector transfected cells normalized by total S6K control (mean ± s.d., n = 3 independent experiments). (b) HEK293T cells were treated with different concentrations of ML-SA1 for 3 hr. Cells were lysed and subjected to immunoblotting. The plot shows the dose-response curve of ML-SA1 normalized by total S6K. (c) Scrambled shRNA or TRPML1 shRNA transduced HEK293T cells were treated with varying concentrations of MLSA1 for 3 hr. Cells were lysed and subjected to immunoblotting. The plot shows the percentage of p-S6K levels compared with scramble shRNA transduced vehicle control treated 293T cells normalized by GAPDH loading control (mean ± s.d., n = 3 independent experiments). (d) HEK293T cells were pretreated with bafilomycin A1 (1 μM) or GPN (200 μM) for 1 hr, followed by treatment with or without MLSA1 for an additional 1.5 hr. Cells were lysed and subjected to immunoblotting. The plot shows the percentage of p-S6K levels compared with vehicle control normalized by GAPDH loading control (mean ± s.d., n = 3 independent experiments). *p<0.05, **p<0.01, n.s. no significant difference.


