. 2016 Oct 26;5:e20930. doi: 10.7554/eLife.20930

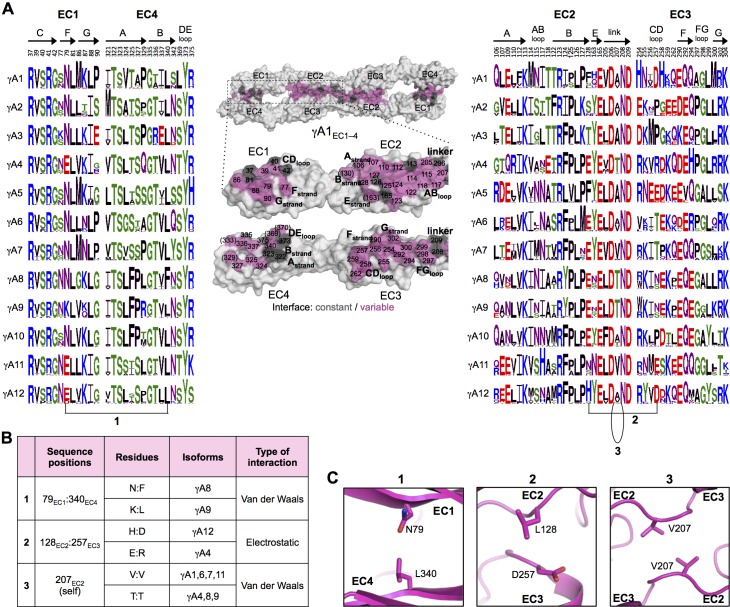
Figure 4. γA-Pcdh trans-binding specificity is encoded across the entire EC1–4 interface.

(A) The central panel shows a surface view of the fully engaged EC1–4 γA1 dimer, with half of the two-fold symmetric interface opened out to reveal the interacting faces. Interfacial residues are labeled and colored grey if they are constant among all γA isoforms or colored magenta if they vary among γA isoforms. The left and right hand panels show sequence logos for interfacial residues in EC1:EC4 (left) and EC2:EC3 (right) for each of the 12 mouse γA isoforms. The logos are generated from sequence alignments of multiple isoform-orthologs (see Materials and methods). Secondary structure elements are annotated above the logos. The numbered connections between residue pairs correspond to the numbered rows in B. (B) Exemplar pairs of interacting residues that show conserved differences among a subset of γA isoforms and may therefore contribute to specificity. (C) Close-up views of the three interacting residue pairs highlighted in B are shown for the γA1EC1–4 structure.

DOI: http://dx.doi.org/10.7554/eLife.20930.021

Figure 4—source data 1. List of species used in generating the sequence logos for γA-Pcdh isoforms.
DOI: 10.7554/eLife.20930.022

Figure 4.

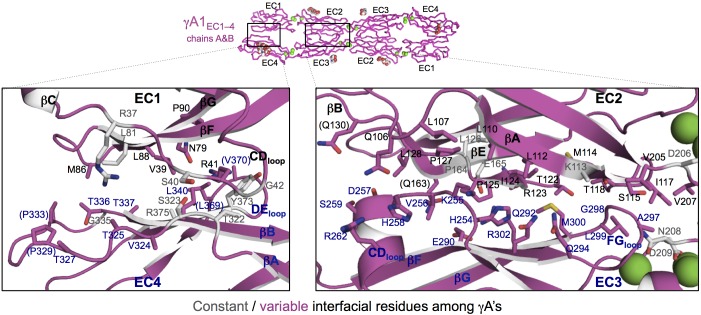
Figure 4—figure supplement 1. γA1EC1–4 dimer interface.

Figure 4—figure supplement 1.

Close-up views of the EC1:EC4 (left) and EC2:EC3 (right) interactions in the γA1EC1–4 dimer. Interfacial residues are shown as sticks and labeled. Residues in parentheses are only marginally interfacial. Bound calcium ions are shown as green spheres. The resolution of the crystal structure is only 4.2 Å and therefore the exact positions of residues and the side chain rotamers may not be completely accurate. In addition no electron density was observed for some side chains and therefore only the first carbon of the side chain was built.
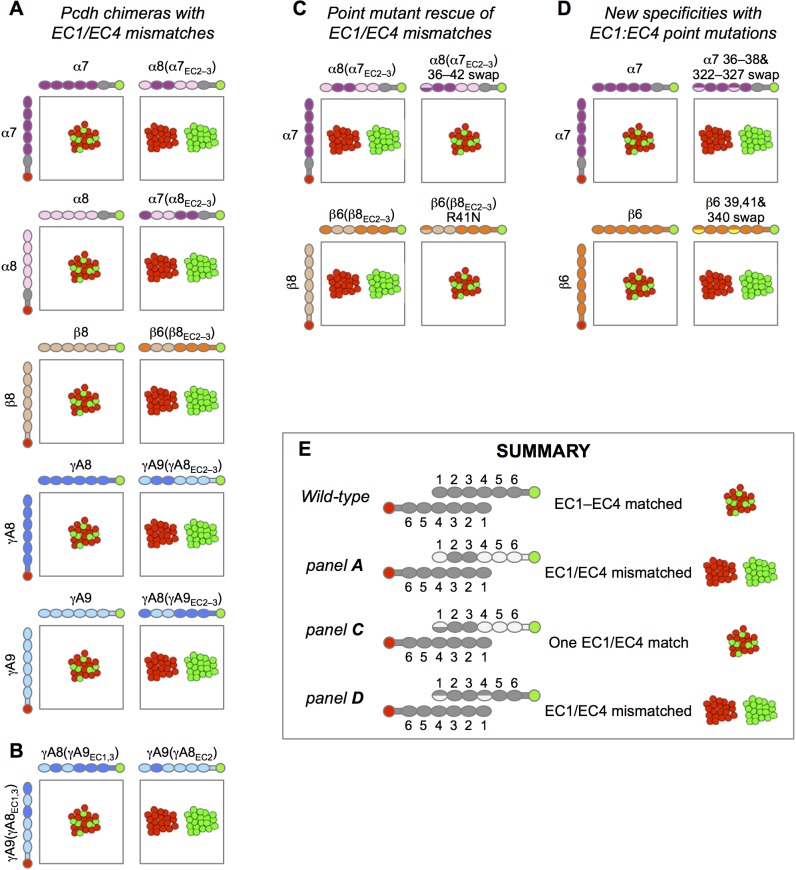
Figure 4—figure supplement 2. Experimental evidence for EC1:EC4 interactions contributing to Pcdh specificity.

Figure 4—figure supplement 2.

Schematic depiction of the published results of mixed K562 cell aggregation assays. Each panel shows the results of mixing two cell populations: one expressing an mCherry-labeled Pcdh (red), and one expressing an mVenus-labeled Pcdh (green). (A) Data from Figure S3 in Rubinstein et al. (2015). When the both cell populations express the same Pcdh, mixed red/green cell aggregates form (left column). However, when a Pcdh chimera containing EC1 and EC4 from a different Pcdh is expressed, these cells no longer mix with the wild-type Pcdh (right column). (B) Data from Figure 6B in Rubinstein et al. (2015). Expression of chimeric molecules with matched EC1:EC4 and EC2:EC3 interactions results in recognition and the formation of mixed aggregates (left), whilst a mismatched EC1:EC4 interaction results in separate aggregates (right, homophilic binding preference). (C) Data from Figure 5 in Rubinstein et al. (2015). Point mutation of EC1 interfacial residues to those of the wild-type parent molecule restores binding of EC1/EC4 mismatched chimeras to the wild-type Pcdh. (D) Data from Figure 5 in Goodman et al. (2016). Point mutations in interacting EC1:EC4 residues from those in the wild-type Pcdh to those of a different Pcdh isoform from the same subfamily (α7 with α8 EC1:EC4 residues above and β6 with β5 EC1:EC4 residues below) results in generation of a new specificity with homophilic binding preferences with respect to the wild-type Pcdh. (E) Summary of the results shown in this figure.