Figure 7. The mating type chromosome (chromosome 1) of U. bromivora UB1 (MAT-1) and UB2 (MAT-2).
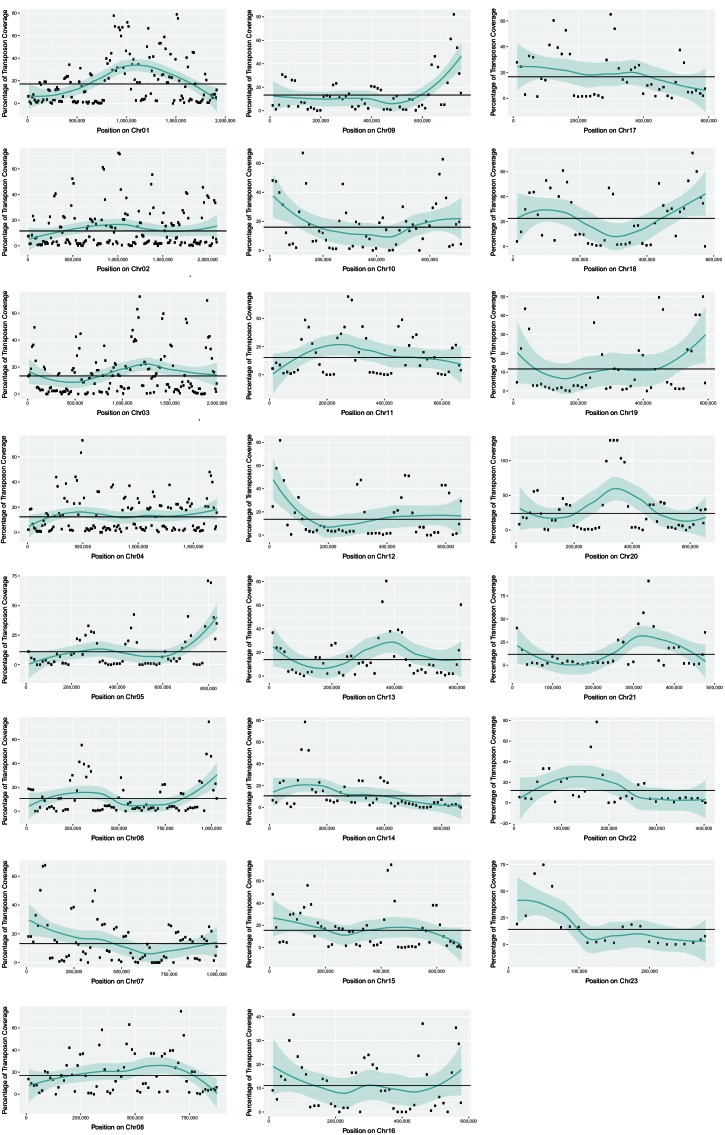
(A) Schematic representation of the a locus (encoding the predicted pheromone receptor system) and the b locus (encoding the putative heterodimeric transcription factor for pathogenic development) of UB1 (MAT-1 strain) and UB2 (MAT-2 strain) according to de novo assembly of both strains. Potential rga2 and lga2 orthologs, encoding proteins for uniparental mitochondrial inheritance (Fedler et al., 2009), are located in the a2 region between mfa2 and pra2. *Due to rearrangements in the mating type region of UB2, the orientation of a2 and b2 locus could not be exactly determined. However, data suggest an inversion of the a2 locus. (B) The mating type region of UB1 is enriched for transposable elements. Graph depicts percentage of transposon coverage in 25 kb windows occurring every 12.5 kb along the chromosome. (C) Mapping of UB2 to the UB1 reference genome shows large non-mapped stretches in the MAT-1 locus indicating sequence differences in this region between MAT-1 and MAT-2. (D) Enrichment of single nucleotide polymorphisms (SNPs) in and around the mating type region between the genomes of UB1 and UB2. Number of SNPs is shown in 5 kb windows.
DOI: http://dx.doi.org/10.7554/eLife.20522.017


