Figure 3.
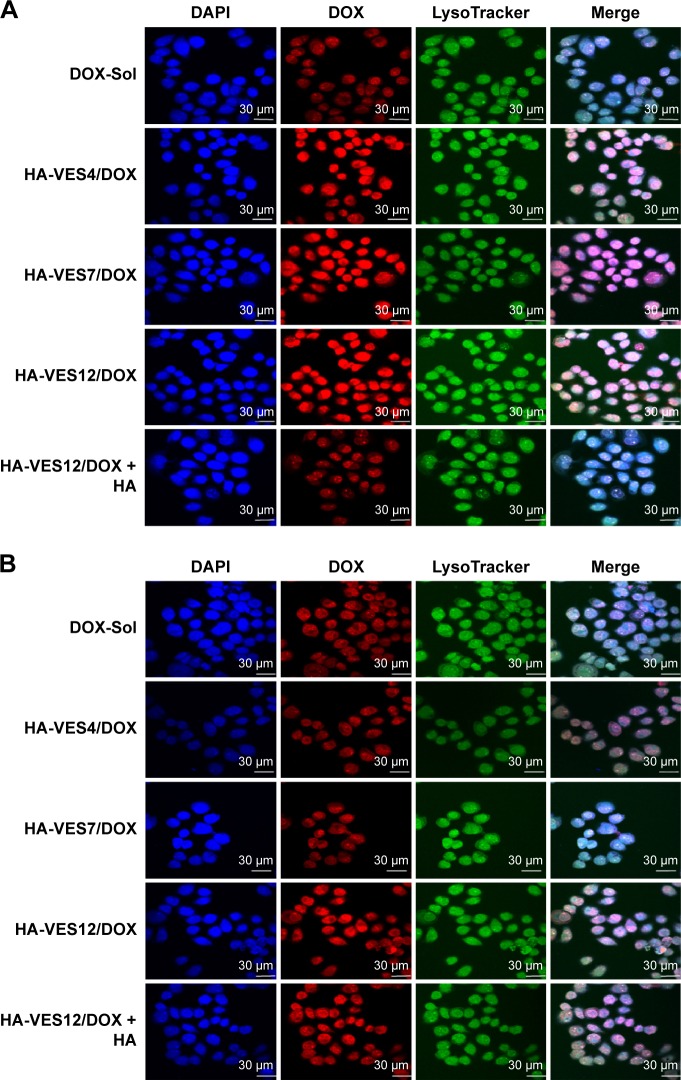
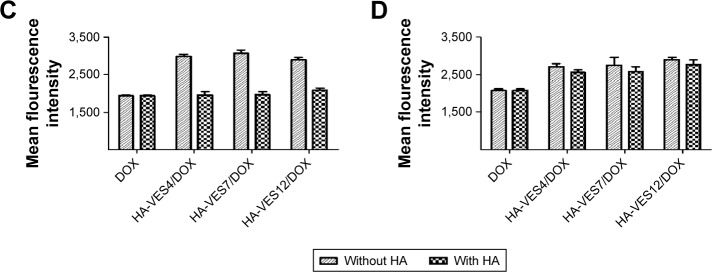
Cellular uptake of DOX-Sol, HA-VES/DOX, and HA-VES12/DOX + HA with 8 μg/mL DOX after incubation for 2 hours in MCF-7 and HepG2 cells.
Notes: (A and B) Qualitative CLSM images of competitive inhibition assays in MCF-7 (A) and HepG2 cells (B). Cells were counterstained with DAPI for marking the nuclei and LysoTracker Green for marking the lysosome. Scale bar: 30 μm. (C and D) Quantitative FACS analysis of competitive assays in MCF-7 (C) and HepG2 cells (D). (Mean ± SD, n=3).
Abbreviations: CLSM, confocal laser scanning microscopy; DAPI, 4′,6-diamidino-2-phenylindole; DOX, doxorubicin; FACS, fluorescence-activated cell sorting; HA, hyaluronic acid; HA-VES/DOX, DOX-loaded HA-vitamin E succinate polymeric micelles; SD, standard deviation.


