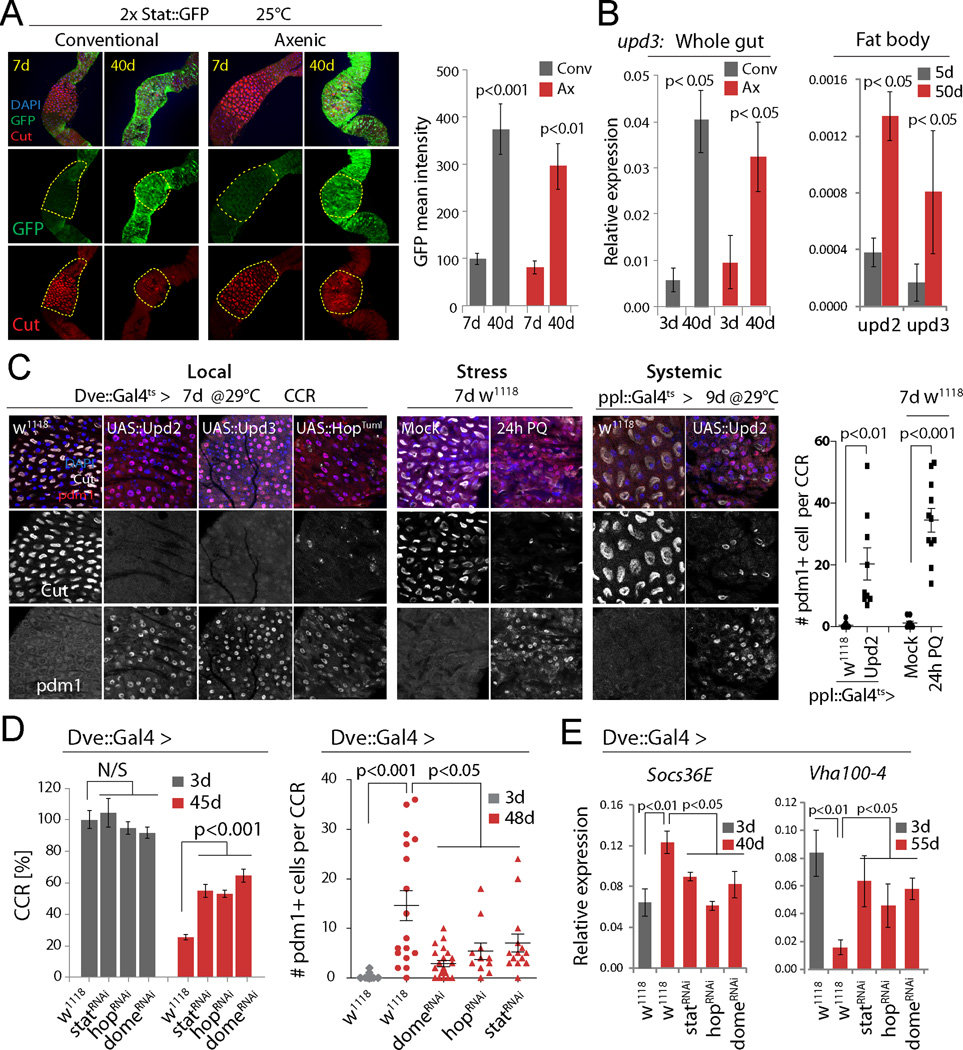
Figure 3. Age-related activation of JAK/Stat causes CC loss and metaplasia.
(A) Expression of 2xStat::GFP (green) in young and old CCRs. GFP intensity quantified on the right (normalized to 100 for young conv. condition). Averages and s.e.m. (t-test). Conv.: N=8, 8. Axenic: N=5, 9. Representative of 3 independent experiments.
(B) qRT-PCR measuring upd3 expression (normalized to actin5C) in guts, and upd2 and upd3 in fat bodies, of w1118 flies. Averages and s.e.m. (t-test). N=3 biological replicates.
(C) Immunostaining detecting Cut+ CCs and Pdm1+ cells in the CCR. (Local) wild-type flies or flies over-expressing Upd2, Upd3, or HopTuml. (Stress) treatment with 80mM Paraquat (PQ). (Systemic) over-expression of Upd2 using the fat body driver ppl::Gal4ts. Quantifications of Pdm1+ cells per CCR from stress and systemic conditions are shown. Averages and s.e.m. (t-test), N=12, 10, 10, 12. Data are representative of 3 independent experiments for Local, and 2 independent experiments for Stress and Systemic conditions.
(D) Knockdown of JAK/Stat signaling components limits age-induced gastric decline. Left: N=12, 11, 11, 12, 20, 20, 16, 22. Right: N=20, 17, 22, 12, 15. Averages and s.e.m. (t-test). Representative from 3 independent experiments.
(E) qRT-PCR detecting Socs36E and Vha100-4 in guts of wild-type (w1118) or StatRNAi, HopRNAi or DomeRNAi expressing flies. Averages and s.e.m. (t-test). N=3 biological replicates.
See also Fig. S3

