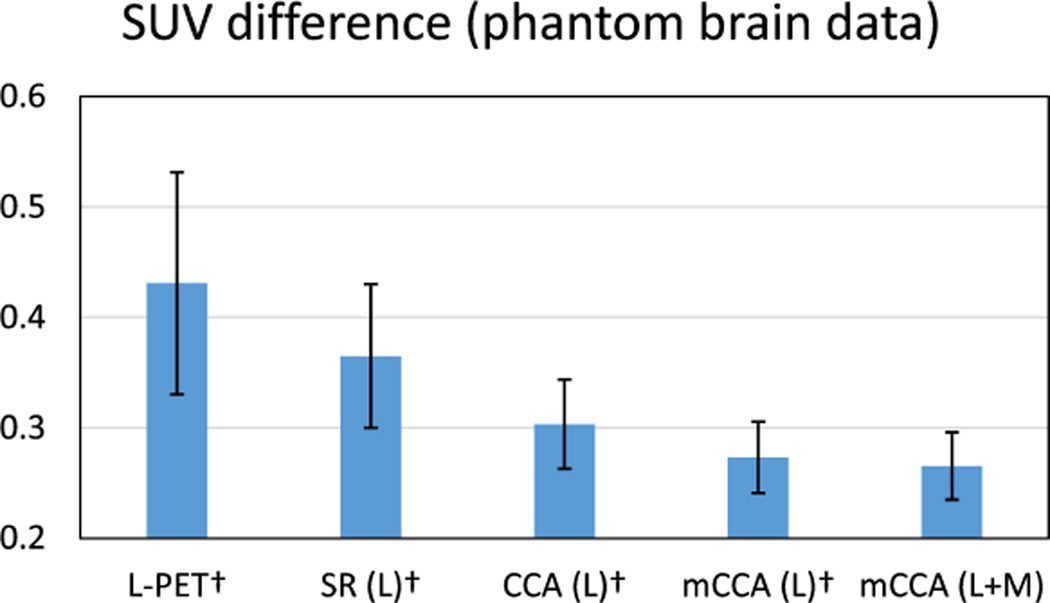
Fig. 8.
Average SUV difference on the phantom brain dataset. The ROI for computing SUV is the lesion region. L means using L-PET as the only estimation source, and L+M means using both L-PET and MRI for estimation. Error bars indicate standard deviation. Lower score is better. † indicates p < 0.01 in the t-test as compared to our method.

