
Fig. 2. Changes in (A) SBP (B) DBP (C) MAP in rats during the 8 weeks of Lb. casei strain C1 administration.
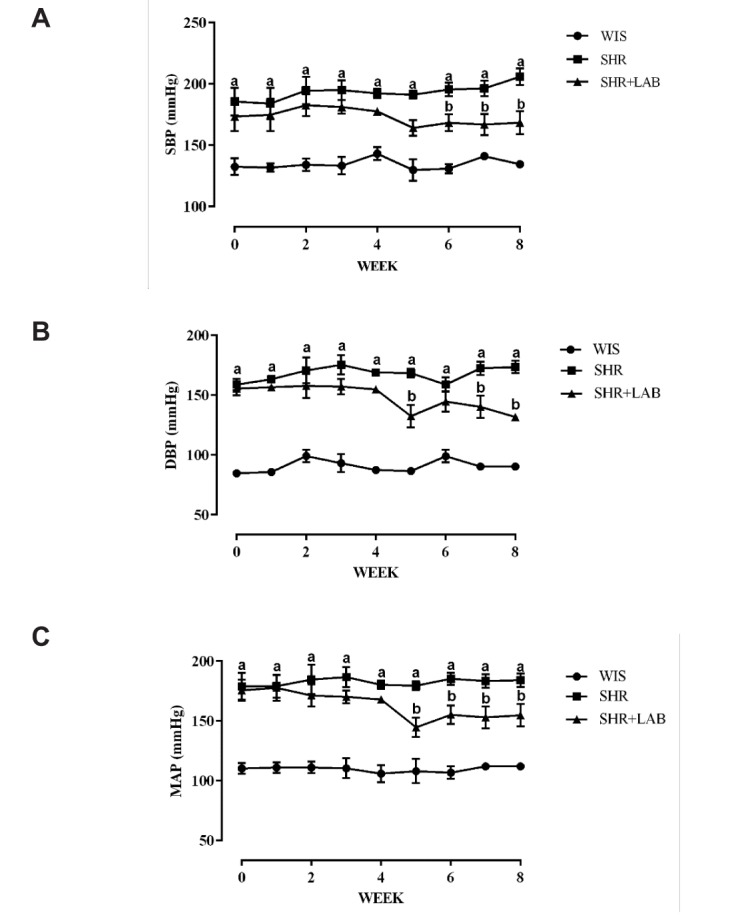
Values are given as mean with SEM for n=6 each group. asignificant in relative to WIS (p<0.05), bsignificant in relative to SHR (p<0.05).
Official websites use .gov
A
.gov website belongs to an official
government organization in the United States.
Secure .gov websites use HTTPS
A lock (
) or https:// means you've safely
connected to the .gov website. Share sensitive
information only on official, secure websites.
Values are given as mean with SEM for n=6 each group. asignificant in relative to WIS (p<0.05), bsignificant in relative to SHR (p<0.05).