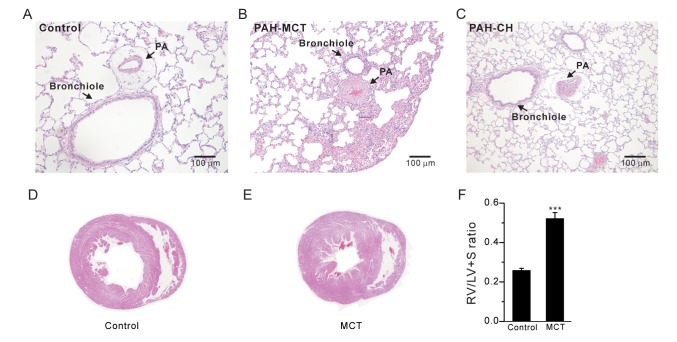
Fig. 1. Medial thickening of PAs and right ventricular hypertrophy in PAH-MCT rats.
(A~C) Representative histological images (H&E staining) of the lungs from the control (A), PAH-MCT (MCT, B), and PAH-CH (CH, C) rats. Compared to the control, the PAs from the MCT-injected and CH-exposed rats showed marked hypertrophic changes. (D, E) Representative images of the heart from the control (D) and PAH-MCT (E) rats. (F) The right ventricular hypertrophy index [RV/(LV+S)] is shown as bar graphs. ***p<0.001.

