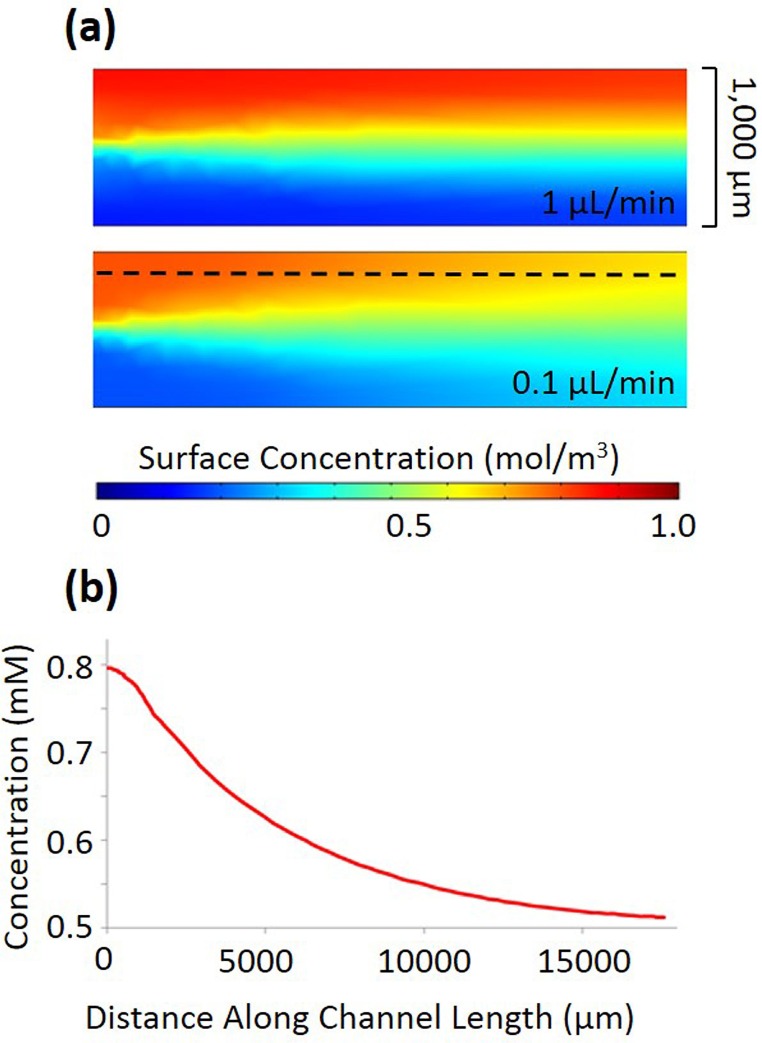
FIG. 4.
(a) Concentration gradient decay in a 1000 μm channel for flow rates of 1 μl/min and 0.1 μl/min without cell introduction. (b) The profile of concentration along the channel length at 200 μm away (shown by dashed line in (a)) from the wall with the highest concentration of chemoattractant at 0.1 μl/min flow rate.

