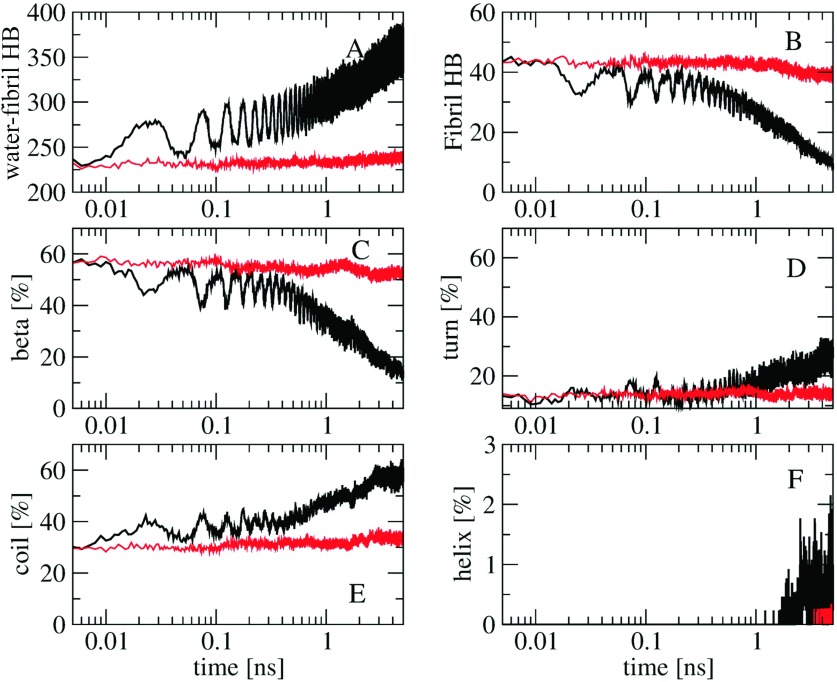
FIG. 4.
Time-evolution of the number of H-bonds between water and fibril (a), the number of the intra-fibril H-bonds (b), and the content of various secondary structures including β (c), turn (d), coil (e), and helix (f). Shown are ensemble averaged results obtained from 10 NEMD simulations with the bubble radius oscillating between Rmin = 0.2 nm and Rmax = 0.6 nm, frequency τ = 50 ps (black), and from 10 equilibrium simulations with a constant pressure of 3000 bars (red).

