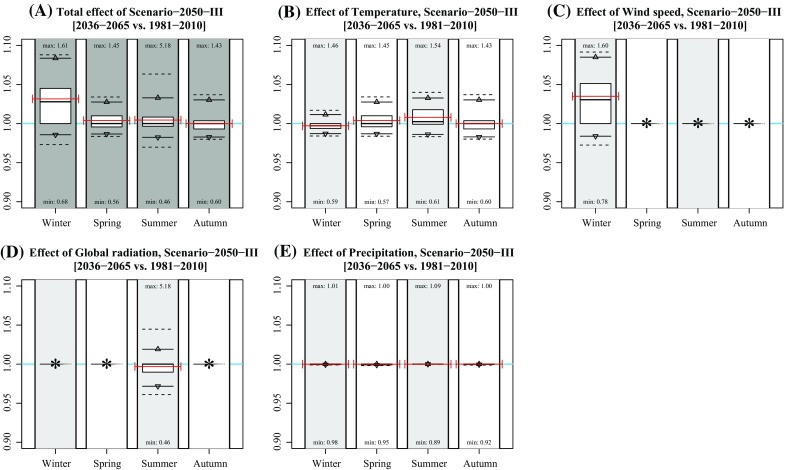
Fig. 5.

Effect of individual variables on projected concentration in Scenario-2050-III. a Idem as Fig. 1e; b–f idem as subplot A, but based on modified concentrations of changing single variable data (temperature, wind speed, global radiation, and precipitation). Numbers near the boxplots represent the minimum and maximum rates per season. The red lines represent the mean concentration (a) and mean rates of changes (b–f) of the years 2009, 2044, and 2064. Asterisks indicate that the effect was not included for that season
