Fig. 5.
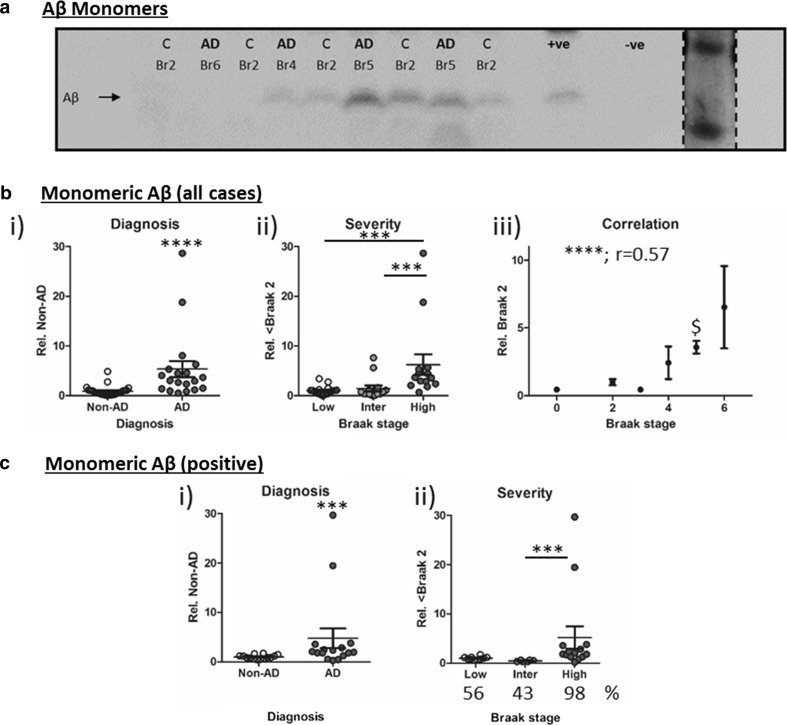
Monomeric β-amyloid (Aβ). Immunoblot for a monomeric Aβ (6E10 antibody). Diagnosis (Non-AD (C) cf. AD) and Braak stage is stated for each case. Positive (+ve) control: human APP overexpressing mouse and negative (−ve) control (wild-type mouse) samples are also shown. Size comparison was established via a Coomassie stained low molecular weight protein ladder (insert). Quantification was conducted either for all cases (b) or only for samples where a band was evident (c), the percentage (%) of cases in which monomeric Aβ was detected is stated below the graph. Total protein adjusted immunosignal stratified to i) diagnosis ii) severity (Low: Br 0–2, Intermediate (Inter): Br 3–4 and High: Br 5–6) and iii) correlation with individual Braak stage. Significances are illustrated as ***p < 0.001, ****p < 0.0001, Spearman’s correlation is also stated. $: indicates the earliest Braak stage at which immunoreactivity was higher than that observed at Braak stage 0

