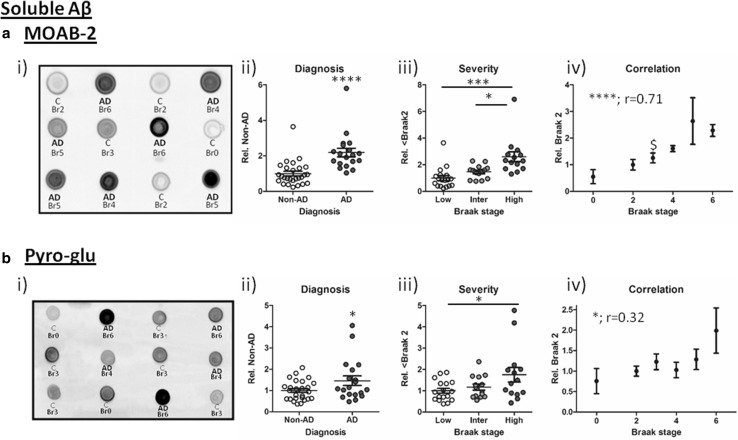
Fig. 7.
Soluble Aβ detection. Example immunoblots for a i) MOAB-2 and b i) pyro-glu reactive Aβ; each case is labelled with corresponding diagnosis [Non-AD (C) cf. AD] and Braak stage. Quantified signals normalised to total protein are shown stratified to ii) diagnosis iii), severity (Low: Br 0–2, Intermediate (Inter): Br 3–4 and High: Br 5–6) and iv) correlation with Braak stage. *p < 0.05, ***p < 0.001, ****p < 0.0001 and Spearman’s correlation r is stated in iv. $ denotes lowest Braak stage at which immunoreactivity differed from Braak 0

