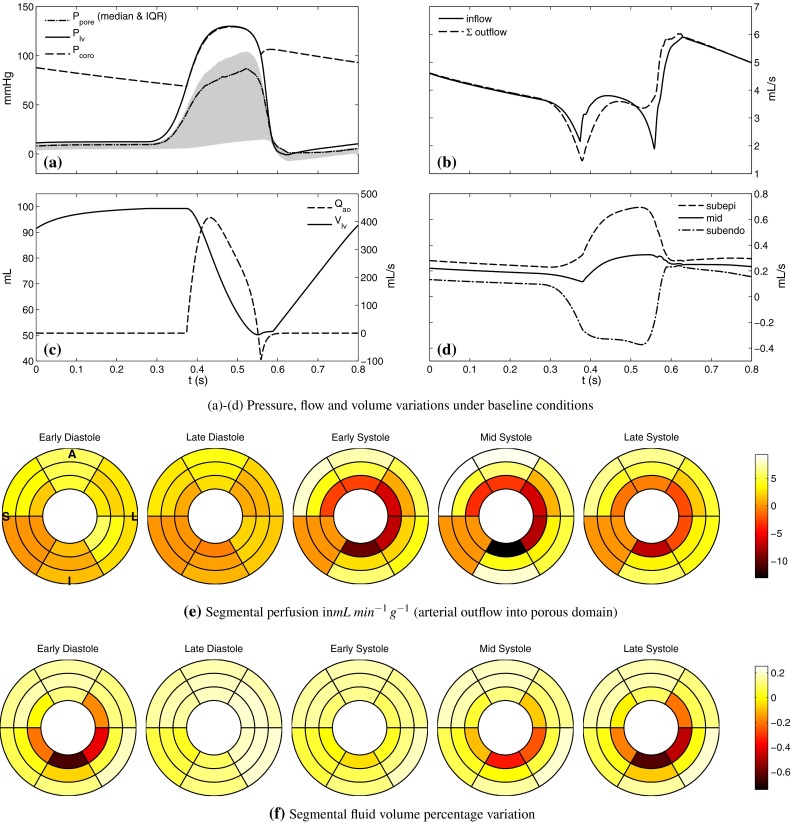
Fig. 3.

Baseline results a coronary inlet pressure, LV cavity pressure and distal pore pressure (median and inter-quartile range over the nodes). Although not shown in this figure, the maximum pore pressure in excess of LV pressure was found during systole, consistent with experimental observations. b Inflow and total outflow of the upper arterial vascular network. Inflow exceeds the outflow in early systole as the influence of cardiac contraction is greater on the distal arterial flow. The reverse happens during late systole, as the stored flow is discharged. c LV cavity volume and aortic outflow. Transient reversal in flow is observed at end systole, enabled by the modified valve dynamics (see text for details). d Coronary flow across transmural layers shows an augmented systolic flow in the subepicardial layer and a reversed flow in the subendocardial layer. e Tissue segmental perfusion in the mid-equatorial portion of myocardium. Systolic endo-to-epi fluid shift caused by increased pressure can clearly be seen. The inferoseptal segment receives zero flow, due to a lack of vasculature in the region. Slice orientation is shown on the first diagram (anterior/inferior, lateral/septal). f Variation of blood volume in the tissue as a percentage of total reference material volume. Around 1 % maximum variation is observed in the baseline conditions. The deficit in the subendocardial layer lags perfusion rate in time due to capacitance effects
