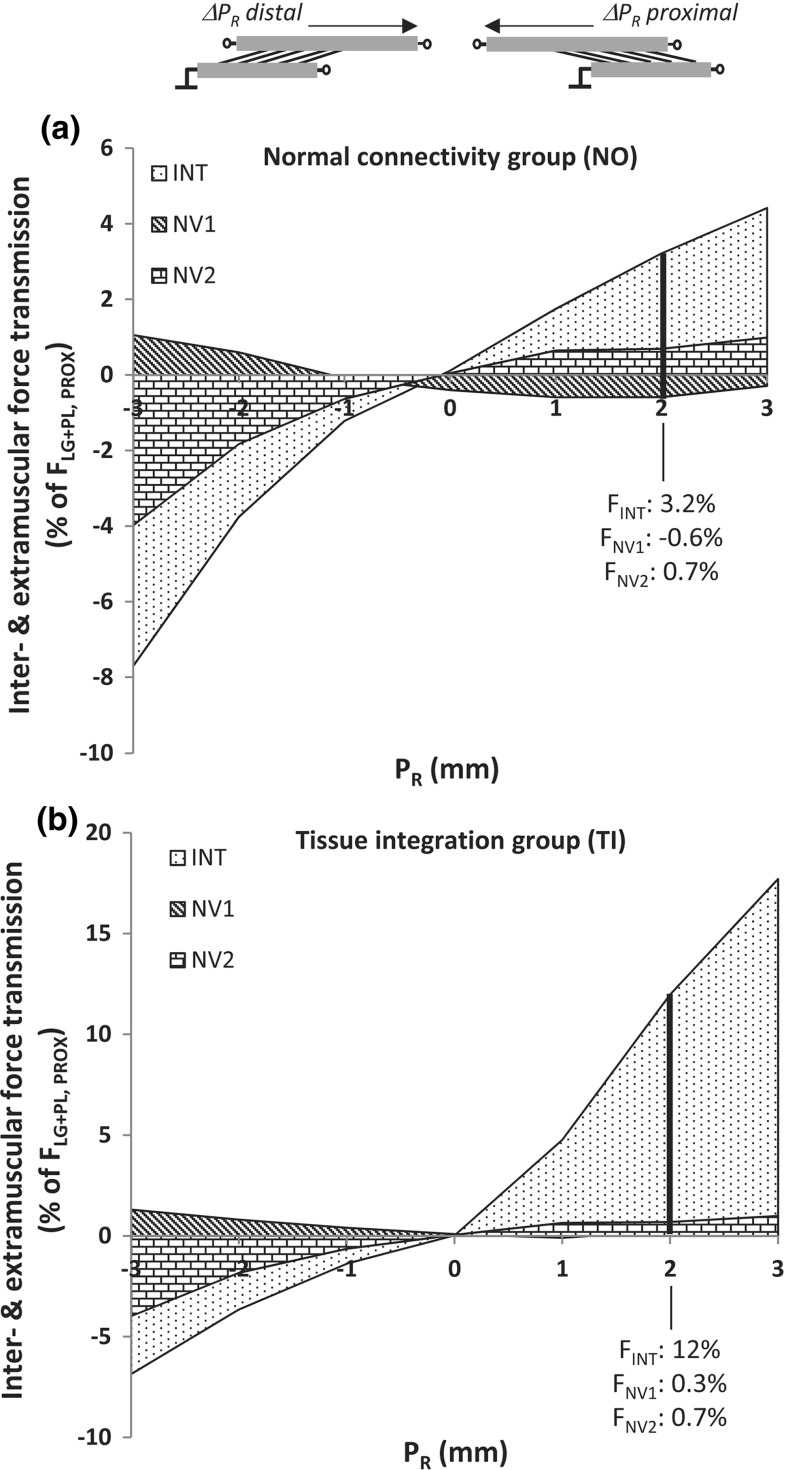
Fig. 4.
Epimuscular force transmission with normal and enhanced connective tissues. Distribution of epimuscularly transmitted force among intermuscular connective tissues (INT) and extramuscular neurovascular tracts (NV1, NV2), over each step of MTUs displacement (). Force values are expressed as a percentage relative to the proximal tendon total force ( [%]) for the normal group (a) and the tissue-integration group (b). As an example, the distribution of force among the different pathways in respect to the myotendinous one, i.e., the proximal tendon, is shown for

