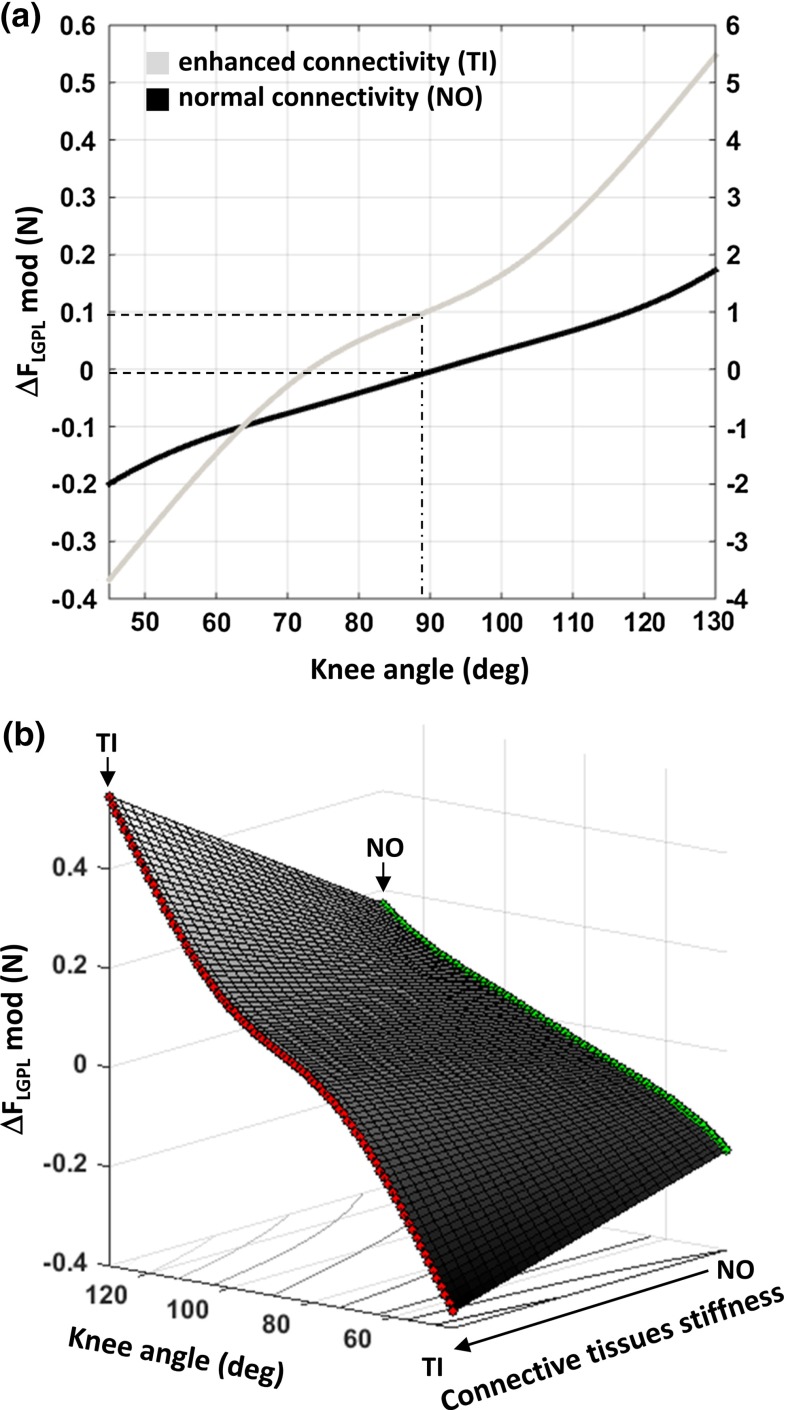
Fig. 6.
Epimuscular force transmission with knee angle extension. Force transmission estimates predicted by the model plotted a as a function of knee angle corresponding to the applied proximal length changes and b as a function of both knee angle and connective tissues stiffness. In the top panel, predicted values of intermuscular and extramuscular force transmission for a knee angle are highlighted for the evaluated intermuscular connectivity conditions, i.e., normal (NO) and enhanced connectivity (TI). The secondary axis expresses the predicted as a percentage of the mean proximal tendon force (, proximal: ). In the bottom panel, linear interpolation of force transmission estimates between NO (green) and TI (red) over the range of corresponding knee angles

