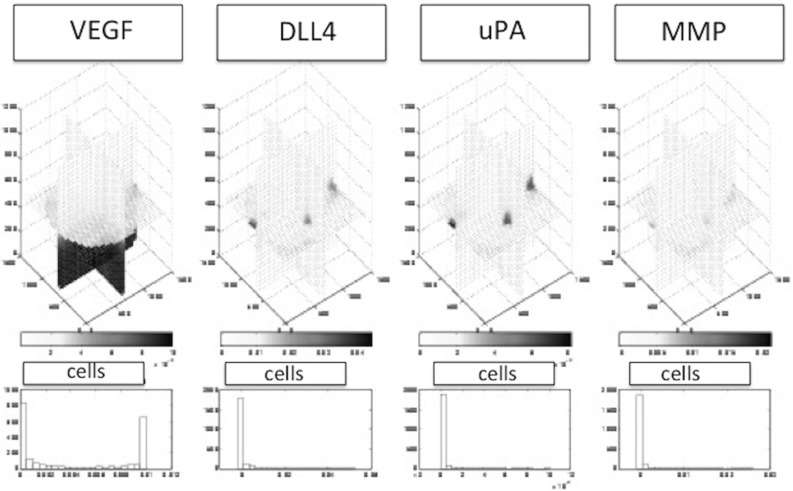
Fig. 12.

The proteins over time in slice plots following the time-dependent reaction–diffusion-sourcing equations. From left to right: VEGF, DLL4, uPA and MMP. Diffusion of the initial VEGF distribution can be observed. Furthermore, sourcing of the other three proteins at the locations of tip cells and diffusion into the surroundings can be observed. MMP and uPA react at a faster rate than DLL4 due to the abundant presence of the substrate components. At the bottom, histograms of the concentrations VEGF, DLL4, uPA and MMP (same order) are shown in terms of values experienced by the cells. This figure is taken after approximately 1 h of simulated time (time3371 s)
