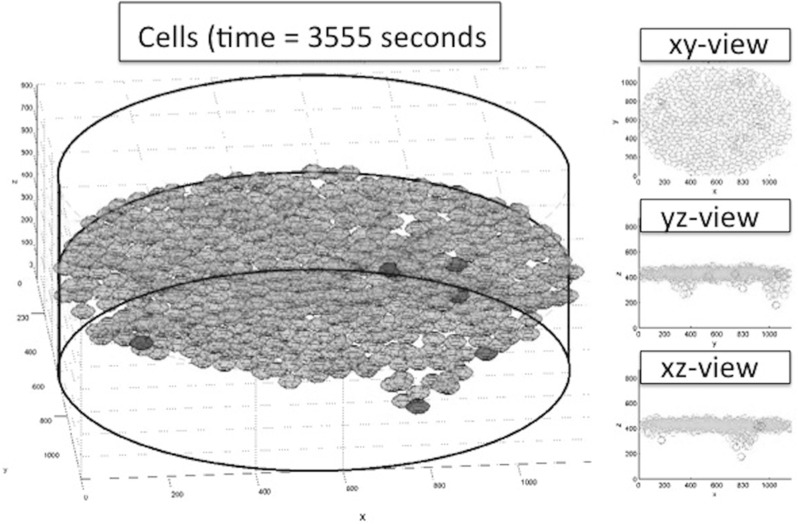
Fig. 9.

Left Cells plot. Tip cells are coloured red in the left three-dimensional plot. The thick black lines form the boundary of the computational domain and aid the reader in orienting the plot. The “camera” is in an angle slightly lower than the x, y plane. On the right, several projections are shown in which the tip cells are indicated by the red crosses
