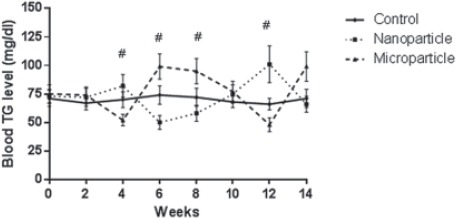
Figure 5.

Comparison of blood triglyceride level of rat (n=6) in MnO2 microparticles or nanoparticles (100 μg/kg) treated groups during the 14 weeks. Repeated measurement test showed a significant (P<0.05) difference in triglyceride between groups. *Control vs. Nanoparticle and microparticle groups, #: Nanoparticles. Microparticle groups.
