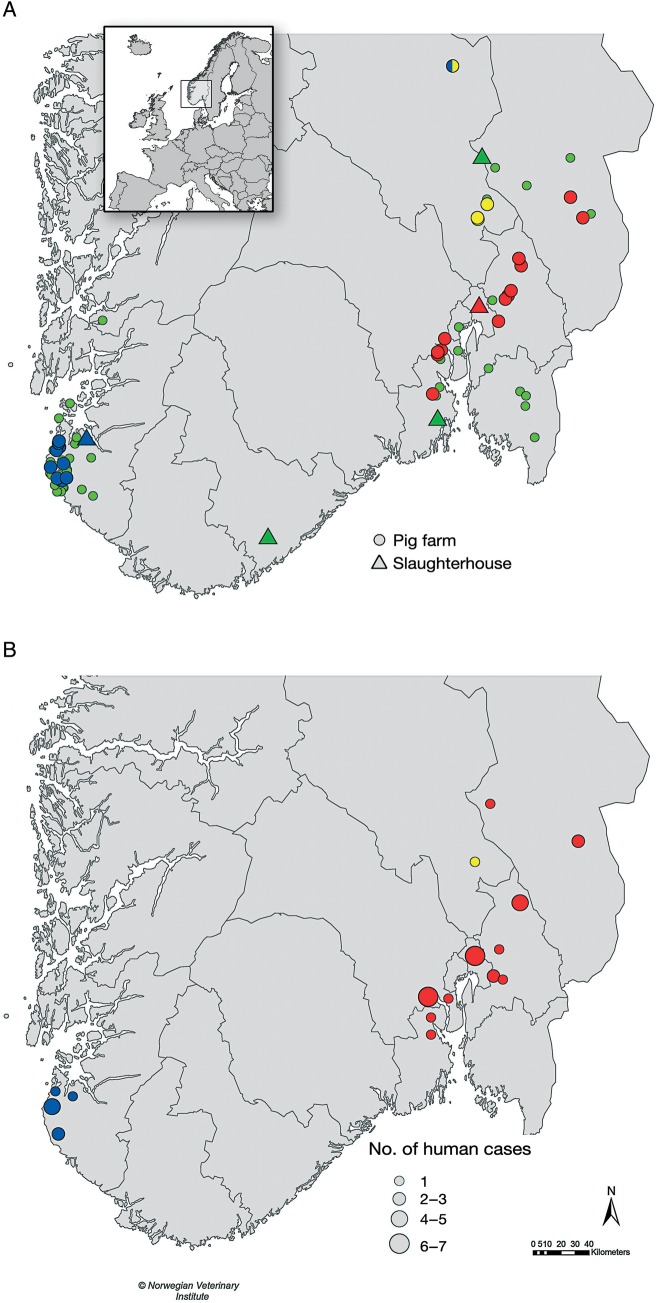
Figure 2.
Geographic distribution of methicillin-resistant Staphylococcus aureus (MRSA) CC398–positive farms (circles) and slaughterhouses (triangles) (A) and MRSA CC398–positive farm or slaughterhouse workers (B) in outbreaks 1 (red), 2 (blue), and 3 (yellow). In A, MRSA CC398–negative farms and slaughterhouses are shown in green. Insert in A depicts Norway in Europe, with box highlighting focus area in A and B.

