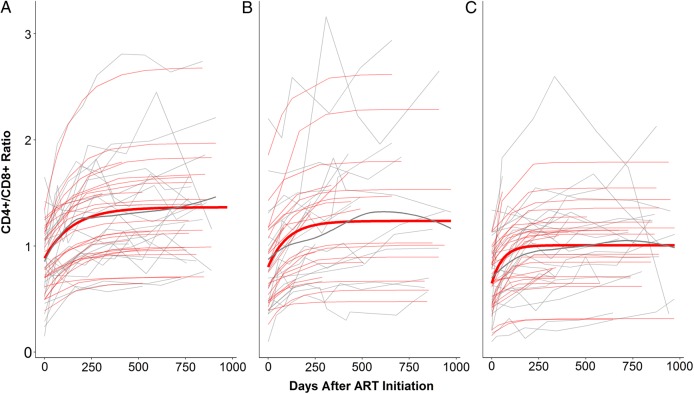
Figure 3.
Model-predicted trajectories of the CD4+/CD8+ ratio by cytomegalovirus (CMV) intercept level: bottom one-third (A), middle one-third (B), and top one-third (C). Light gray lines indicate individual participants. Thin and thick red lines indicate predicted trajectories for individuals and CMV groups, respectively. Thick gray line represents the local regression curve fitted to each group. Abbreviation: ART, antiretroviral therapy.

