
Fig. 3.
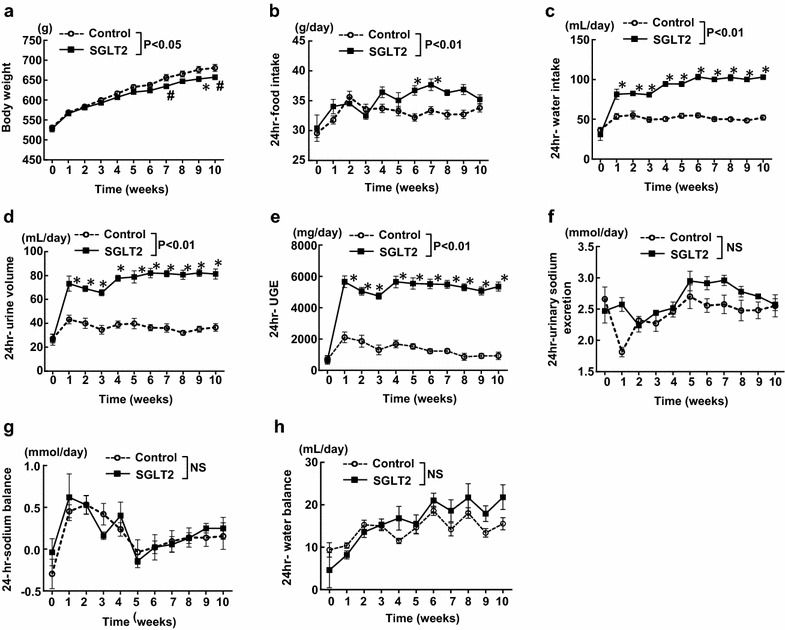
Effect of long-term (10 weeks) empagliflozin treatment on various parameters (a–h) obtained from weekly metabolic cage analysis. Control SHRcp fed control diet; SGLT2, SHRcp fed control diet containing empagliflozin; UGE urinary glucose excretion; NS not significant. Values are mean ± SEM n = 6 in control, n = 6 in SGLT2. Statistical analysis was performed by two-factor ANOVA with repeated measures followed by post hoc Bonferroni’s multiple comparisons test