
Fig. 4.
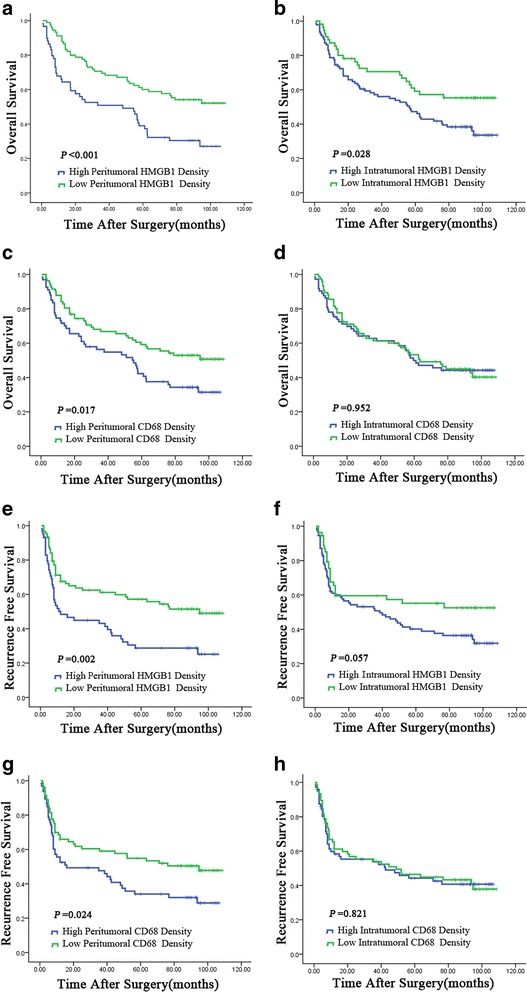
Cumulative overall survival (OS) and recurrence-free survival (RFS) curves of patients with high and low expression of HMGB1 (panels a, b, e, and f) and high and low densities of CD68+ cell infiltration (panels c, d, g, and h) in tumoral and peritumoral liver tissues. In peritumoral liver tissues, the expression of HMGB1 and the density of CD68+ cells were both associated with poor OS and RFS (panels a, c, e, and g). In tumor tissues, the expression of HMGB1 was associated with poor OS but not RFS (panels b and f), while the density of CD68+ cells could not discriminate patients with different OS or RFS (panels d and h)