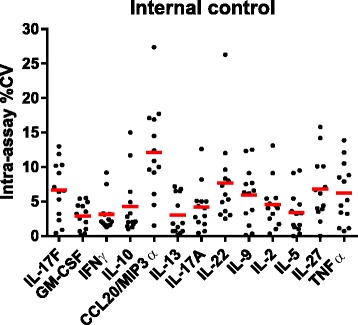
Fig. 5.

Intra-assay variability of internal control. %CV concentration for each of the 13 plates calculated using internal control duplicates for the selected 15-plex Millipore magnetic kit (see Material and Methods). Mean %CVs are represented by red lines. IL-23 and IL-1β %CVs were not calculated due to concentration values < LLOQ and > ULOQ, respectively
