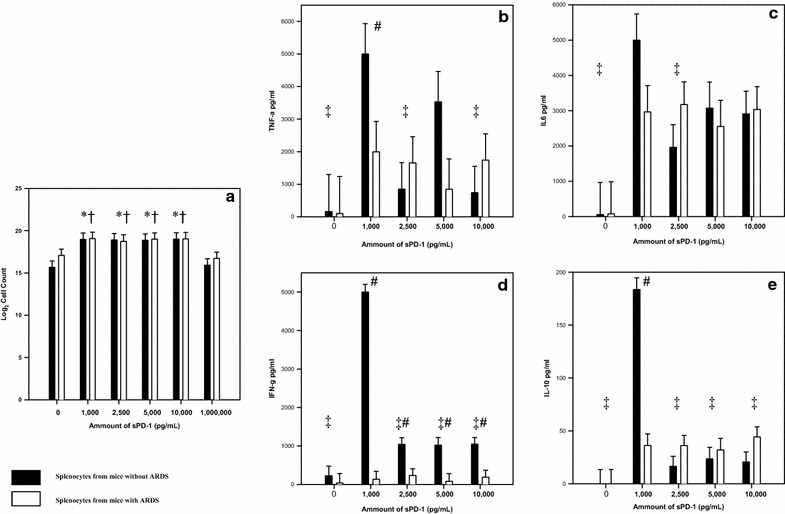
Fig. 4.

Outcome of cells cultured with varying levels of sPD-1 a Proliferation of splenocytes from mice with ARDS (n = 4, experiments in triplicate) compared to mice without ARDS (n = 4, experiments in triplicate). Analysis done by two-way ANOVA with Student-Newman-Keuls method used for multiple comparisons. *p < 0.05 when that amount is compared to 0 ng/mL regardless of whether the cells came from a mouse with ARDS. †p < 0.05 when that amount is compared to 1000 ng/mL regardless of whether the cells came from a mouse with ARDS. b TNF-α levels from splenocytes of mice with ARDS (n = 4) compared to mice without ARDS (n = 4) #p < 0.05 when cells from mice with ARDS are compared to cells from sham mice at that level of sPD-1 ‡p < 0.05 when comparing cells from sham mice to a sPD-1 level of 1 ng/mL c IL-6 levels from splenocytes from mice with ARDS (n = 4) compared to mice without ARDS (n = 4) ‡p < 0.05 when comparing cells from sham mice to a sPD-1 level of 1 ng/mL d IFN-γ levels from splenocytes from mice with ARDS (n = 4) compared to mice without ARDS (n = 4) #p < 0.05 when cells from mice with ARDS are compared to cells from sham mice at that level of sPD-1 ‡p < 0.05 when comparing cells from sham mice to a sPD-1 level of 1 ng/mL e IL-10 levels from splenocytes from mice with ARDS (n = 4) compared to mice without ARDS (n = 4) #p < 0.05 when cells from mice with ARDS are compared to cells from sham mice at that level of sPD-1 ‡p < 0.05 when comparing cells from sham mice to a sPD-1 level of 1 ng/mL
