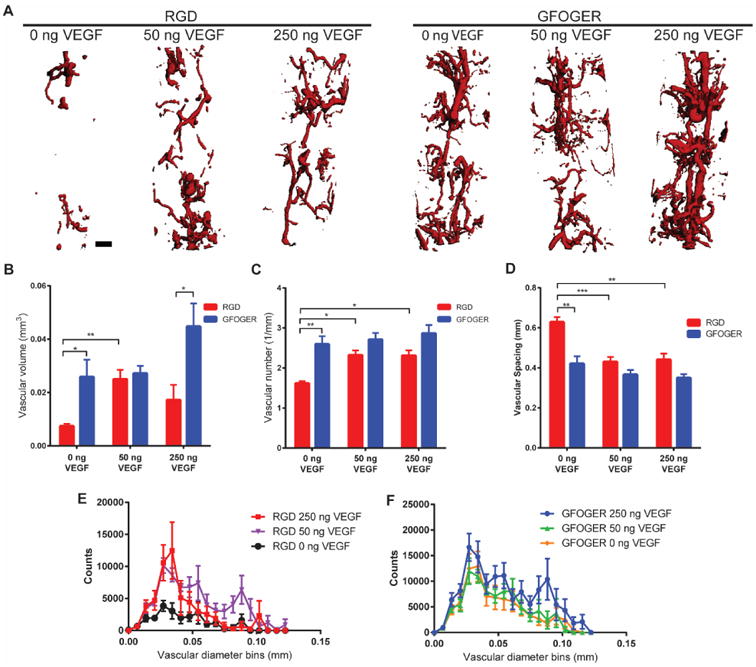
Figure 4.

Vascularization of bone defects. (A) Representative 3D reconstructions of vascular structures within the bone defect for different adhesive peptides and VEGF doses (scale bar = 200 μm). (B,C,D) Vascular volume, number and spacing in bone defect respectively. (E,F) Vascular diameter histogram indicating blood vessel size distribution. (Mean ± SEM, n=5-8) *p < 0.05, **p < 0.01, ***p < 0.001.
