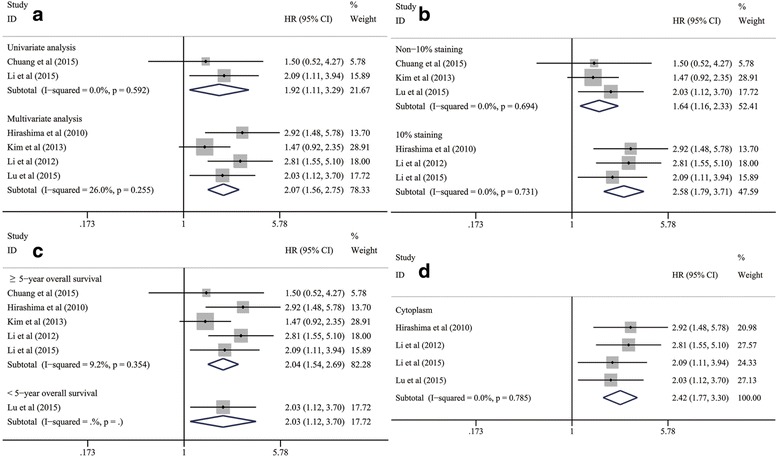
Fig. 4.

Subgroup analyses on the prognostic value of mTOR/p-mTOR expression for OS in subgroups of ESCC patients stratified by (a) statistical analysis, (b) cut-off values, (c) follow-up periods and (d) positive-staining sites. CI, confidence interval; ESCC, esophageal squamous cell carcinoma; HR, hazard ratio; mTOR, mammalian target of rapamycin; p-mTOR, phosphorylated mammalian target of rapamycin; OS, overall survival
