Fig. 2.

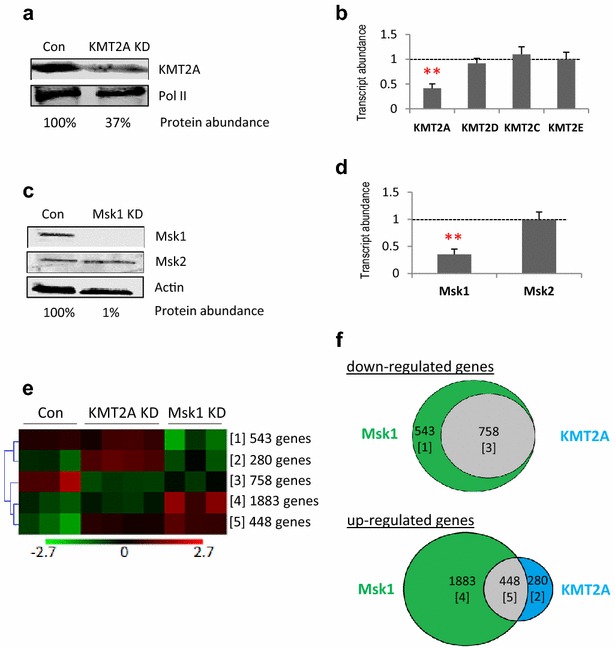
Effects of KMT2A/MLL1 and Msk1 knockdown on HoxA gene expression. a Western analysis of KMT2A/MLL1 abundance in mouse embryo fibroblasts (MEFs), either mock-transfected (Con) or KMT2A/MLL1 knockdown (KD). RNA polymerase II (Pol II) was used as a loading control and to calculate the extent of KMT2A/MLL1 knockdown (37% of control). Full-length blots are given in Additional file 1. b RT-qPCR expression analysis of a selection of KMT2 genes in knockdown cells using actin as a control and with mock-transfected cells normalised to 1.0 (n = 3, T test, *p < 0.05; **p < 0.01; ***p < 0.001). The KMT2E protein has no methyltransferase activity (see text). c Western analysis of Msk1 and Msk2 in mock-transfected (Con) and Msk1 knockdown (KD) MEFs. Actin was used as a loading control and to calculate the extent of Msk1 knockdown (1% of control). A representative western (1 out of 3) is presented. Full-length blots are given in Additional file 1. d RT-qPCR expression analysis of Msk1 and 2 in Msk1 knockdown cells. Transcripts were analysed using actin as a control, with the level of transcripts in mock-transfected cells normalised to 1.0 (n = 3, T test, *p < 0.05; **p < 0.01; ***p < 0.001). e Relative gene expression levels in control (n = 3), KMT2A/MLL1 knockdown (n = 4) and Msk1 knockdown (n = 3) cells are indicated by colour intensity from 2.7-fold down-regulated (green) to 2.7-fold up-regulated (red). 3912 genes showed significant changes in expression following KMT2A/MLL1 and/or MSK1 knockdown and these were clustered into five groups by SOTA analysis; the number of genes in each cluster is indicated. f Venn diagrams showing the numbers and relationship of genes down-regulated (upper panel) or up-regulated (lower panel), by knockdown of KMT2A/MLL1 and/or Msk1. The corresponding SOTA cluster is indicated in brackets
