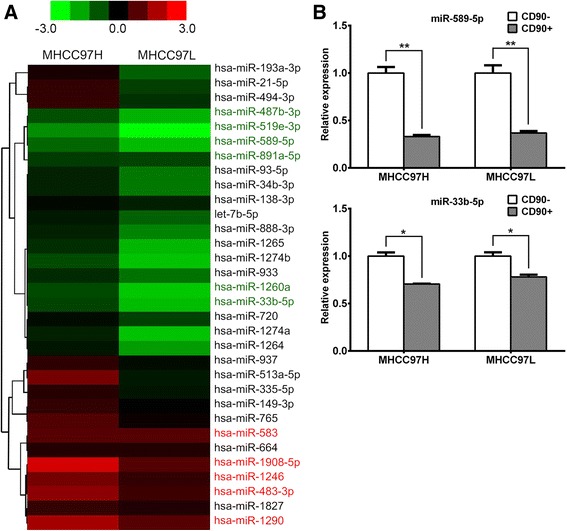
Fig. 1.

miR-589-5p is down-regulated in CD90+ HCC cells. (a) The results of miRNA microarrays were shown as hierarchical clustering of miRNAs that are differentially expressed in CD90+ HCC cells. The color scale illustrates the relative expression level of a miRNA: red color represents a high expression level; green color represents a low expression level. (b) Expression of miR-589-5p and miR-33b-5p in both CD90+ HCC cell lines was determined using qRT-PCR. All data are representative of three independent experiments and are shown as mean ± SEM (n = 3)
