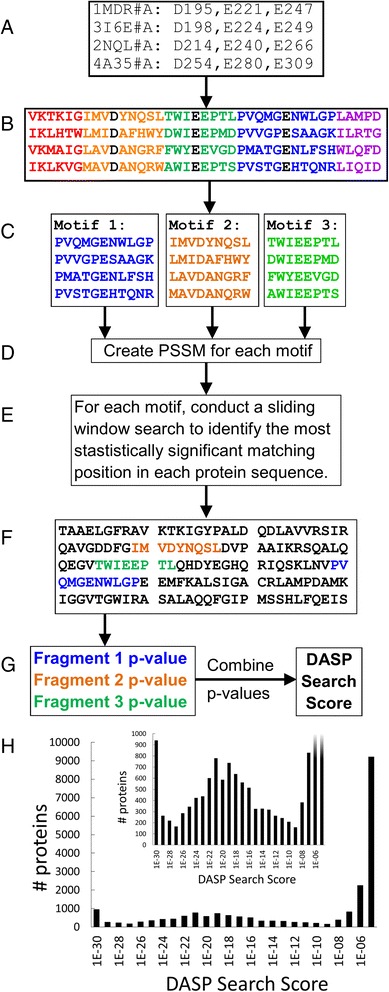
Fig. 1.

DASP flowchart for identifying active site profiles and searching GenBank. Key catalytic residues are chosen for each protein (a) and used to identify sequence fragments in the active site profile (b). The fragments are separated into motifs (c) which are used in the GenBank search. A PSSM is calculated for each motif (d) and a sliding window search (e) is utilized to identify the best positional match for each motif in each protein sequence by calculating a p-value at each position (f). The p-values for each matched motif are combined to calculate a final DASP search score (g). The distribution of DASP search scores for a given GenBank search are visualized using a histogram with DASP search score on the x-axis and the number of proteins identified on the y-axis (h). The inset shows the same histogram with the y-axis capped at 1000 proteins to better highlight the distribution of DASP search scores
