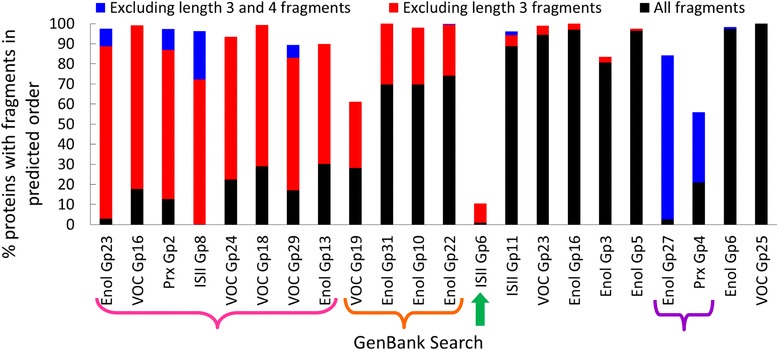
Fig. 3.

Three residue fragments are responsible for the majority of incorrect fragment order. The percent of proteins identified in GenBank searches with all fragments in the predicted N- to C- terminal order is plotted for 22 GenBank searches from four diverse SFLD protein superfamilies. The percent where all fragments are in the predicted order is shown in black bars, whereas red bars show the additional percent achieved when fragments of length three are not considered in the analysis and blue bars show the additional percent when both fragments of length three and four are not considered in the analysis. The green arrow and colored braces are discussed in the text
