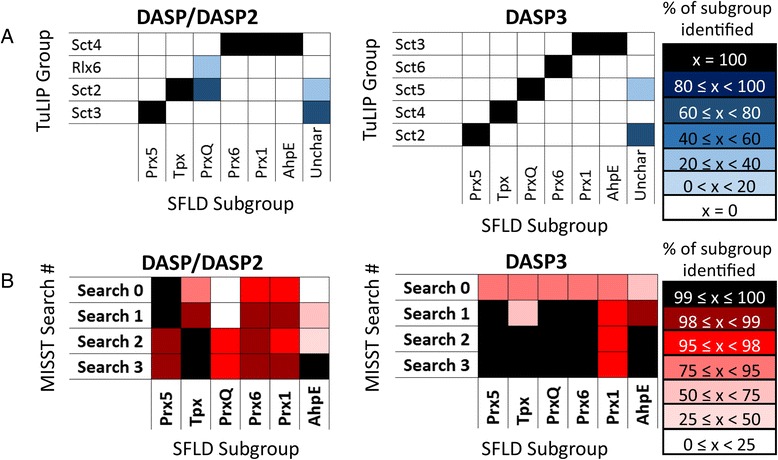
Fig. 7.

DASP3 identifies known Prx functional groups more accurately than previous DASP versions. a The clusters of the Prx superfamily identified by TuLIP are shown as heat maps for DASP/DASP2 and DASP3. The color of each box represents the percent of the known Prx isofunctional group identified by that TuLIP group, as shown by the legend. White boxes indicate no proteins from a functional group are in a given TuLIP group while black boxes indicate all proteins from a functional group are in a given TuLIP group. b Heat maps are used to demonstrate the coverage of each Prx functional group by DASP/DASP2 and DASP3 after each iteration of an iterative sequence search process. Box color indicates the percent of each Prx known functional group identified with DASP search scores ≤ 1E-8 at each iterative search level, as shown by the legend
