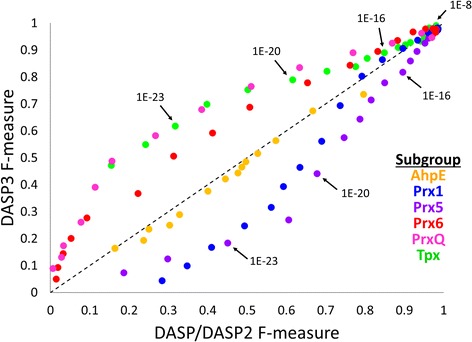
Fig. 8.

DASP3 identifies known Prx sequences in 6 isofunctional groups as well as previous software versions. The F-measure (harmonic mean of precision and recall) of DASP/DASP2 (x-axis) and DASP3 (y-axis) Prx searches is shown as a scatterplot for DASP search scores 1E-8 to 1E-25. The F-measure decreases with increasing DASP search score significance for all six groups, such that 1E-8 is in the upper right and 1E-25 is in the lower left. Color indicates known Prx subgroup, as shown by the legend
