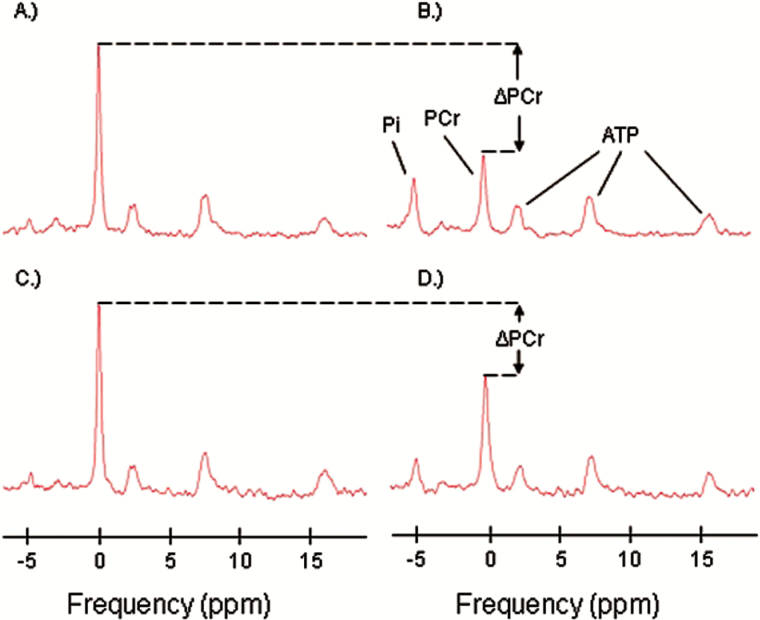
Figure 1.
Representative 31P spectra with inorganic phosphate (Pi), phosphocreatine (PCr), and ATP resonances indicated in panel B. Panels (A) and (B) show example baseline and postexercise spectra representing a typical level of exercise-induced PCr depletion (ΔPCr). Panels (C) and (D) show example baseline and postexercise spectra representing a minimally acceptable level of PCr depletion, with ΔPCr ~ 33%.

