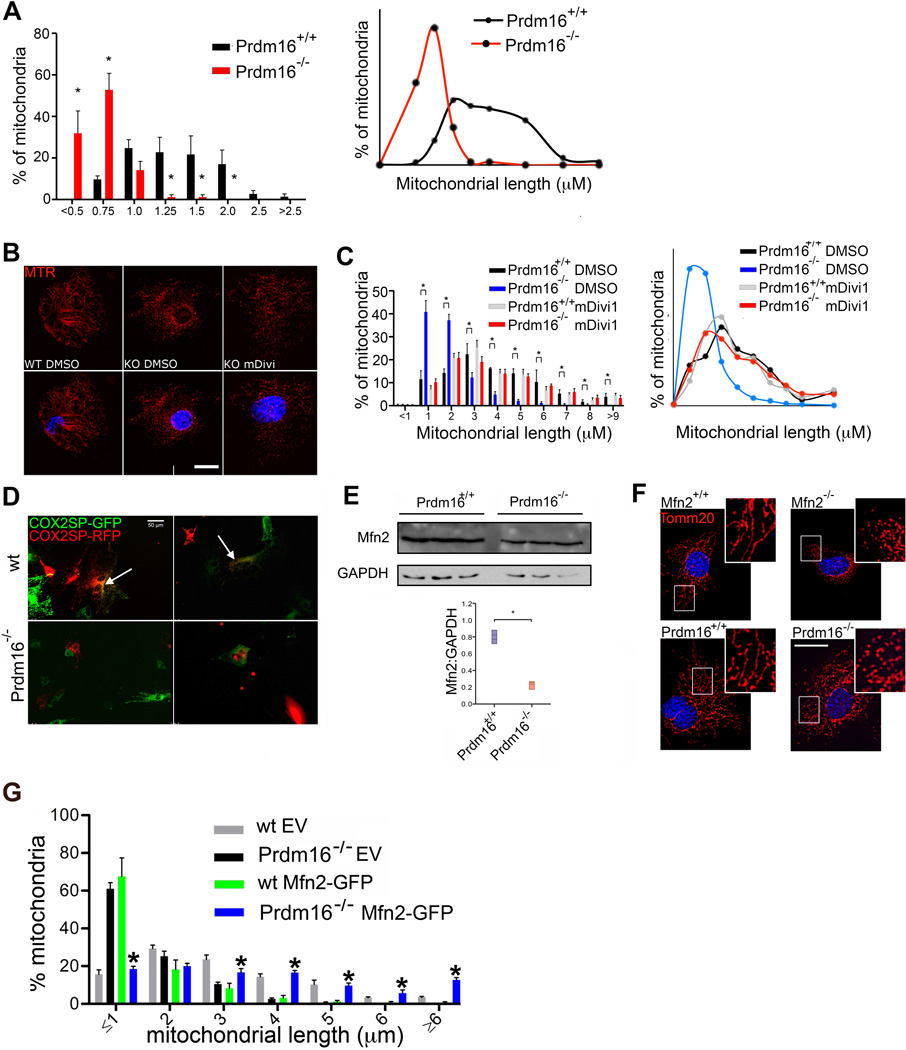
Extended Data Figure 2. Mitochondrial dynamics in Prdm16−/− MEFs.
(A) Frequency distribution (left) and frequency distribution profile (right) of mitochondrial length in Wt or Prdm16−/− fetal HSCs. Bars, mean±s.e.m.; n≥20 fields of cells from three biological replicates; *P<0.05 within length bins; two-tailed student’s t test within length bins. (B) Mitochondrial morphology in Prdm16−/− MEFs treated for 24hrs with the Drp1 inhibitor, mDivi (30µM), or vehicle is shown for comparison, Mitotracker Red staining, scale bar 20µm). (C) Frequency distribution (left) and frequency distribution profile (right) of mitochondrial length in Wt and Prdm16−/− MEFs treated for 24hrs with the Drp1 inhibitor, mDivi (30µM), or vehicle. Bars, mean±s.e.m.; n≥16 fields from three biological replicates; *P<0.05 within length bins; one-way ANOVA with Bonferroni’s post hoc test within length bins. (D) Fluorescence micrographs showing fusion hybrids of Wt or Prdm16−/− MEFs transduced with baculovirus expressing mitochondria-tagged GFP and RFP prior to PEG-mediated fusion (scale bar 50µm). Fused mitochondria are yellow (arrows), and were only observed in fusions of Wt cells. (E) Western blot (upper, Supplementary Fig. 1 for full scans) and quantification of Western blots for Mfn2 of Wt and Prdm16−/− MEFs. Bars, mean±s.e.m.; n=3 fields biological replicates; *P<0.05; two-tailed student’s t test. (F) Mitochondrial morphology in Wt, Prdm16−/− and Mfn2−/− MEFs visualized by Tomm20 staining (red) (scale bar 20µm). (G) Mitochondrial length in Wt and Prdm16−/− MEFs transduced with EV or Mfn2-IRES-GFP (Mfn2-GFP). Bars, mean±s.e.m.; n≥24 fields from three biological replicates; *P<0.05 compared to Prdm16−/− EV in each length bin; one-way ANOVA with Bonferroni’s post hoc test within length bins.

