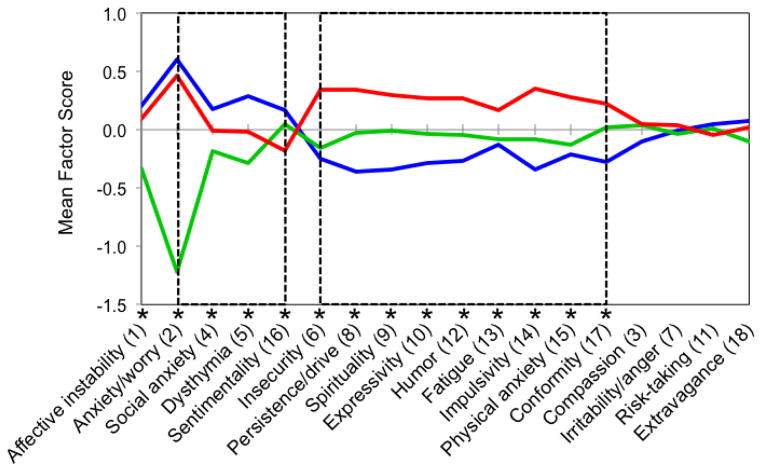
Figure 2.
The three clusters derived from k-means clustering are shown according to group mean scores across all 18 factors. Cluster 1 is shown in blue, cluster 2 is shown in green, and cluster 3 is shown in red. Factors are arranged so as to emphasize the unique personality profiles observed for each cluster. Nearly all factors displayed significant differences between all three groups (p<0.003), as indicated by an asterisk (*).

